Github Trending - Weekly
Github weekly trending
Building a modern alternative to Salesforce, powered by the community.

![]()
The #1 Open-Source CRM
🌐 Website · 📚 Documentation · ![]() Roadmap ·
Roadmap · ![]() Discord ·
Discord · ![]() Figma
Figma
Installation
See:
🚀 Self-hosting
🖥️ Local Setup
Does the world need another CRM?
We built Twenty for three reasons:
CRMs are too expensive, and users are trapped. Companies use locked-in customer data to hike prices. It shouldn't be that way.
A fresh start is required to build a better experience. We can learn from past mistakes and craft a cohesive experience inspired by new UX patterns from tools like Notion, Airtable or Linear.
We believe in Open-source and community. Hundreds of developers are already building Twenty together. Once we have plugin capabilities, a whole ecosystem will grow around it.
What You Can Do With Twenty
Please feel free to flag any specific needs you have by creating an issue.
Below are a few features we have implemented to date:
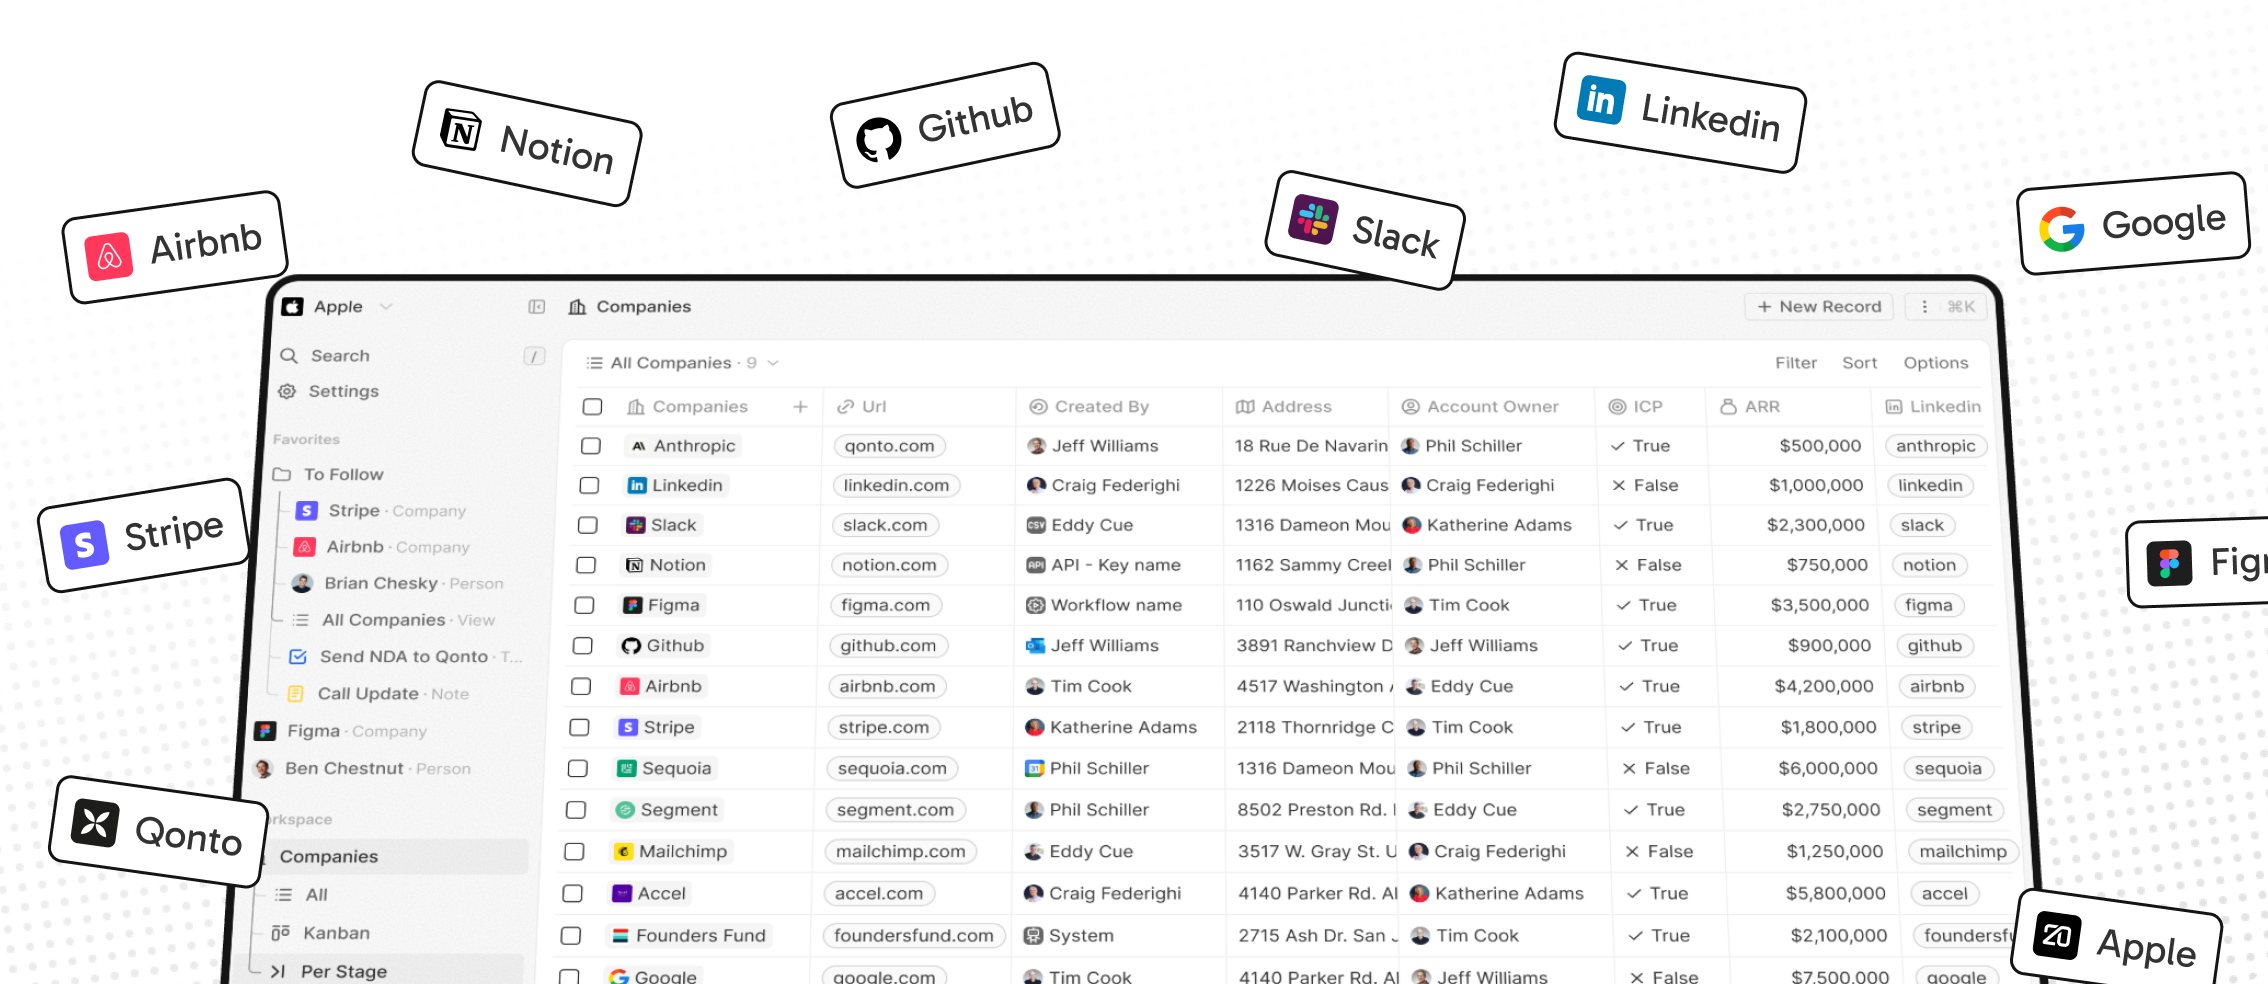
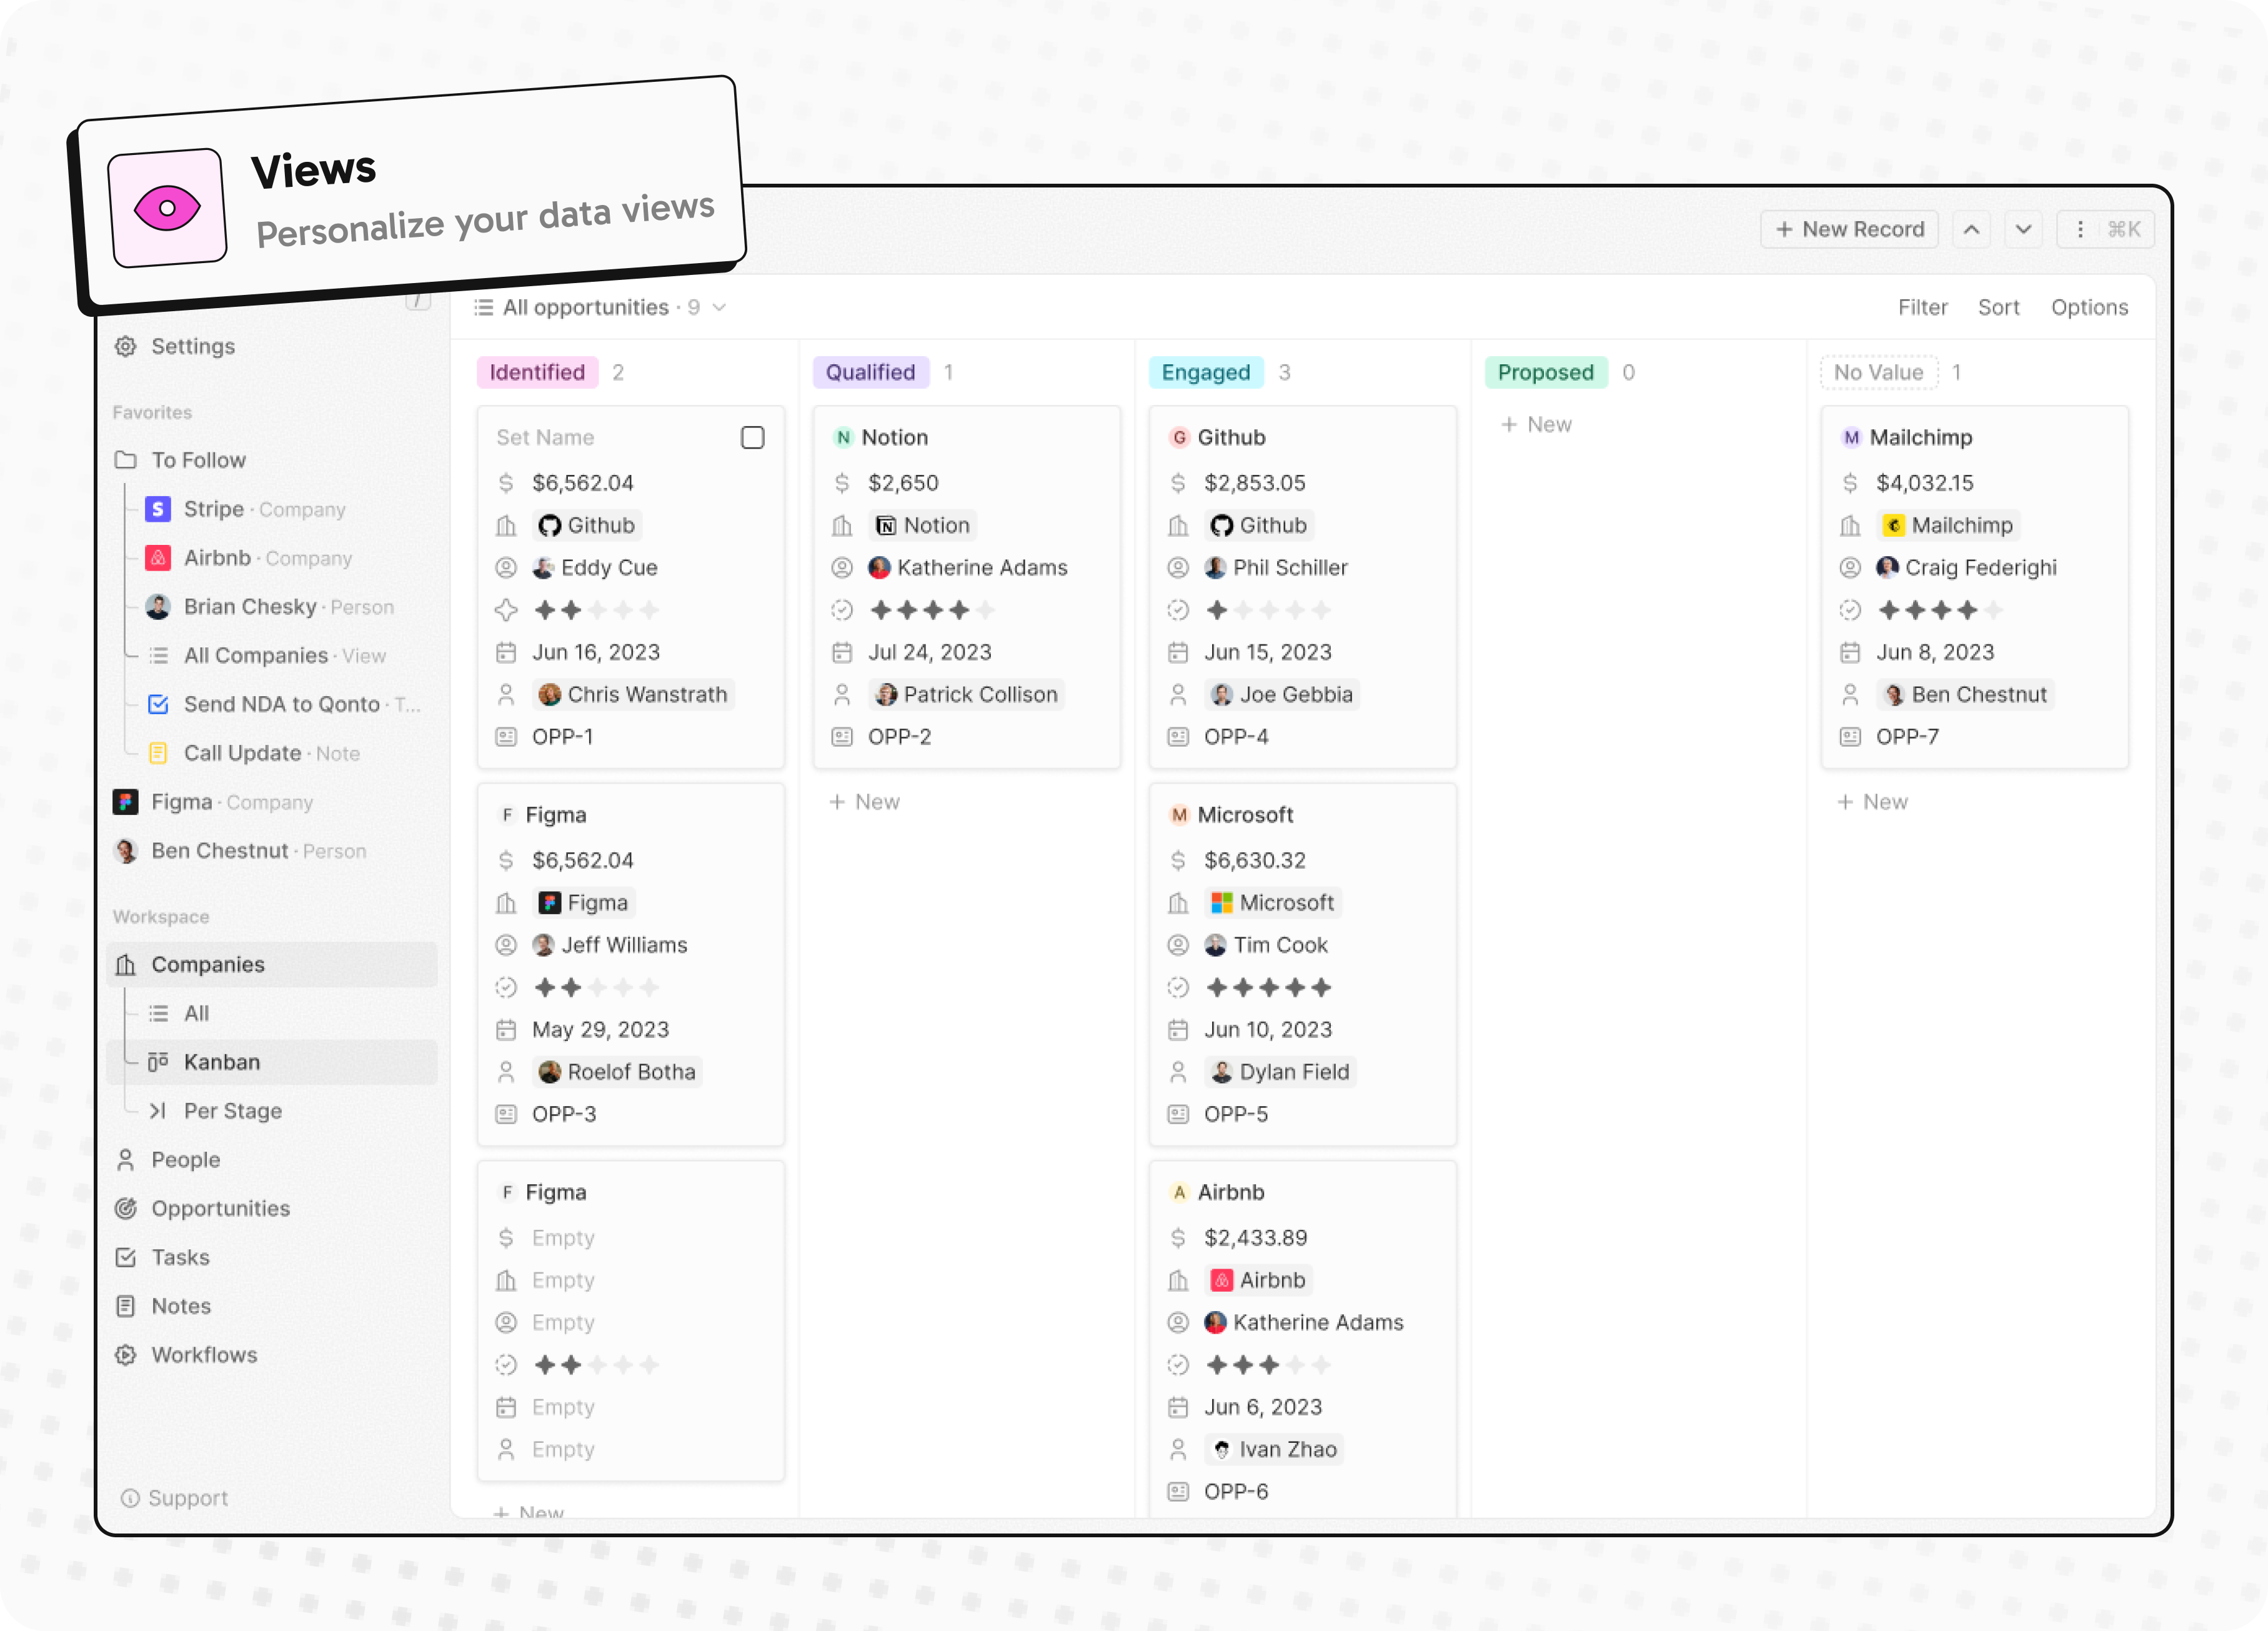
- Personalize layouts with filters, sort, group by, kanban and table views
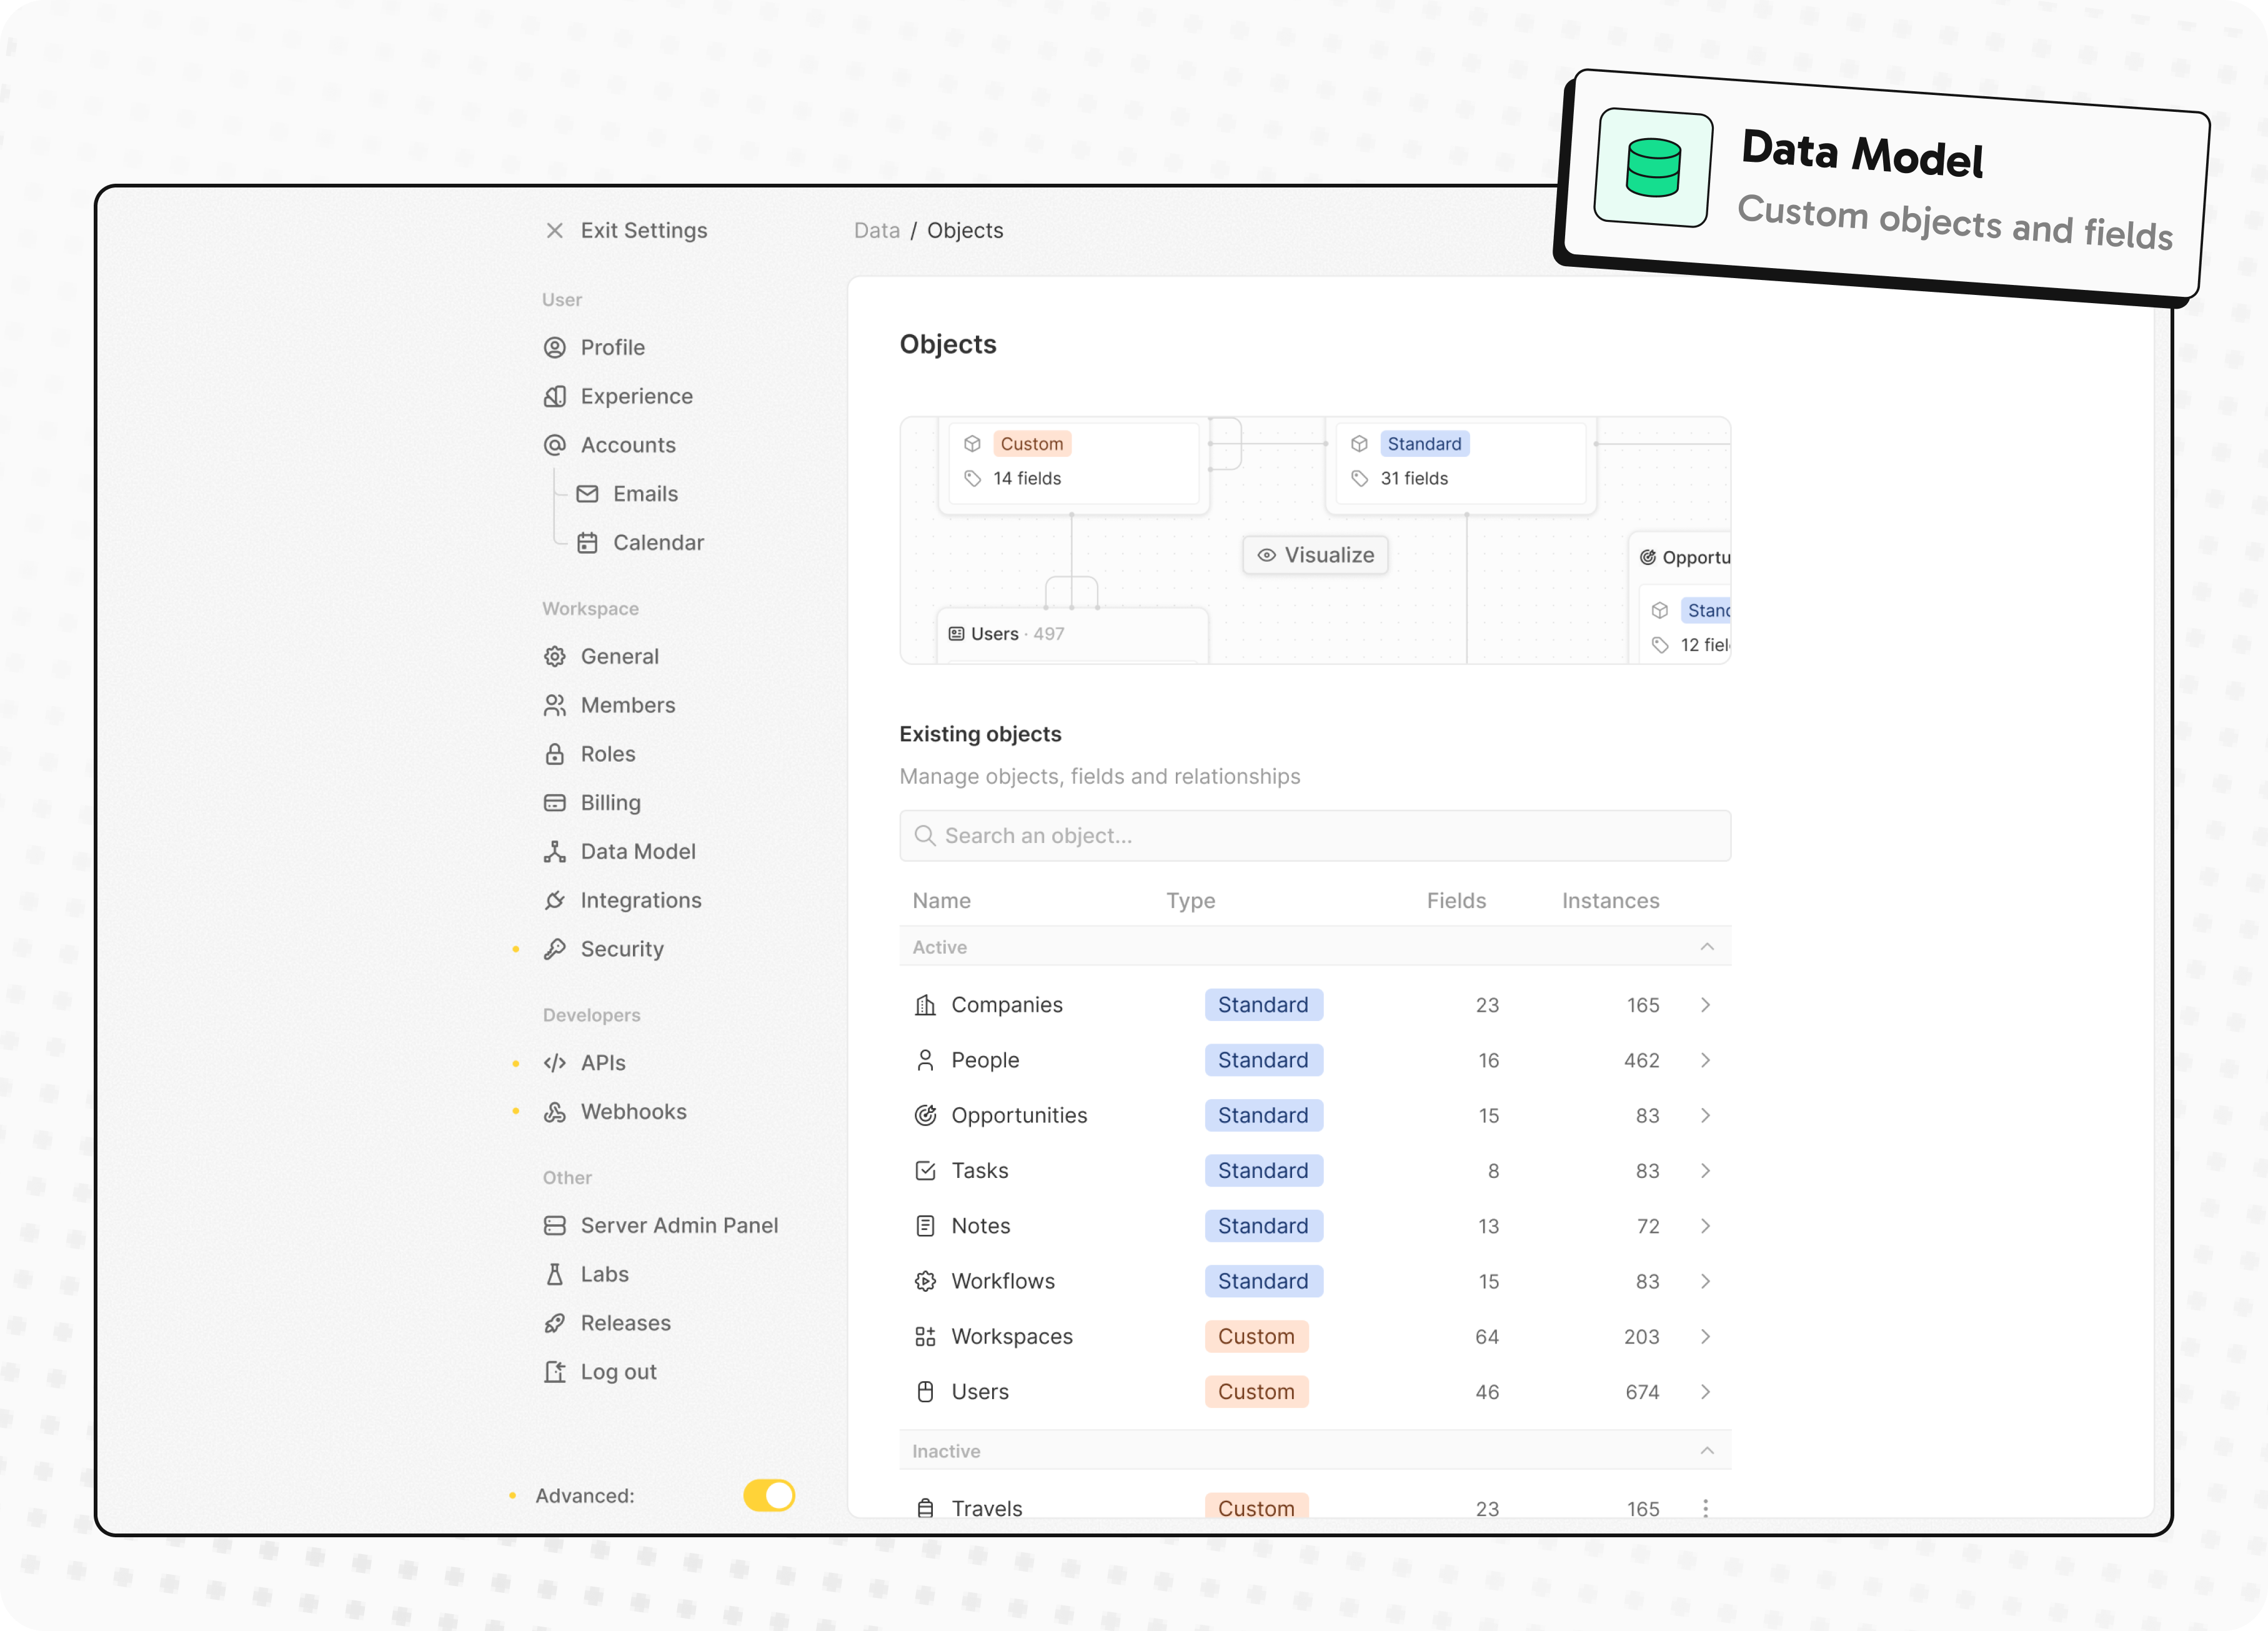
- Customize your objects and fields
- Create and manage permissions with custom roles
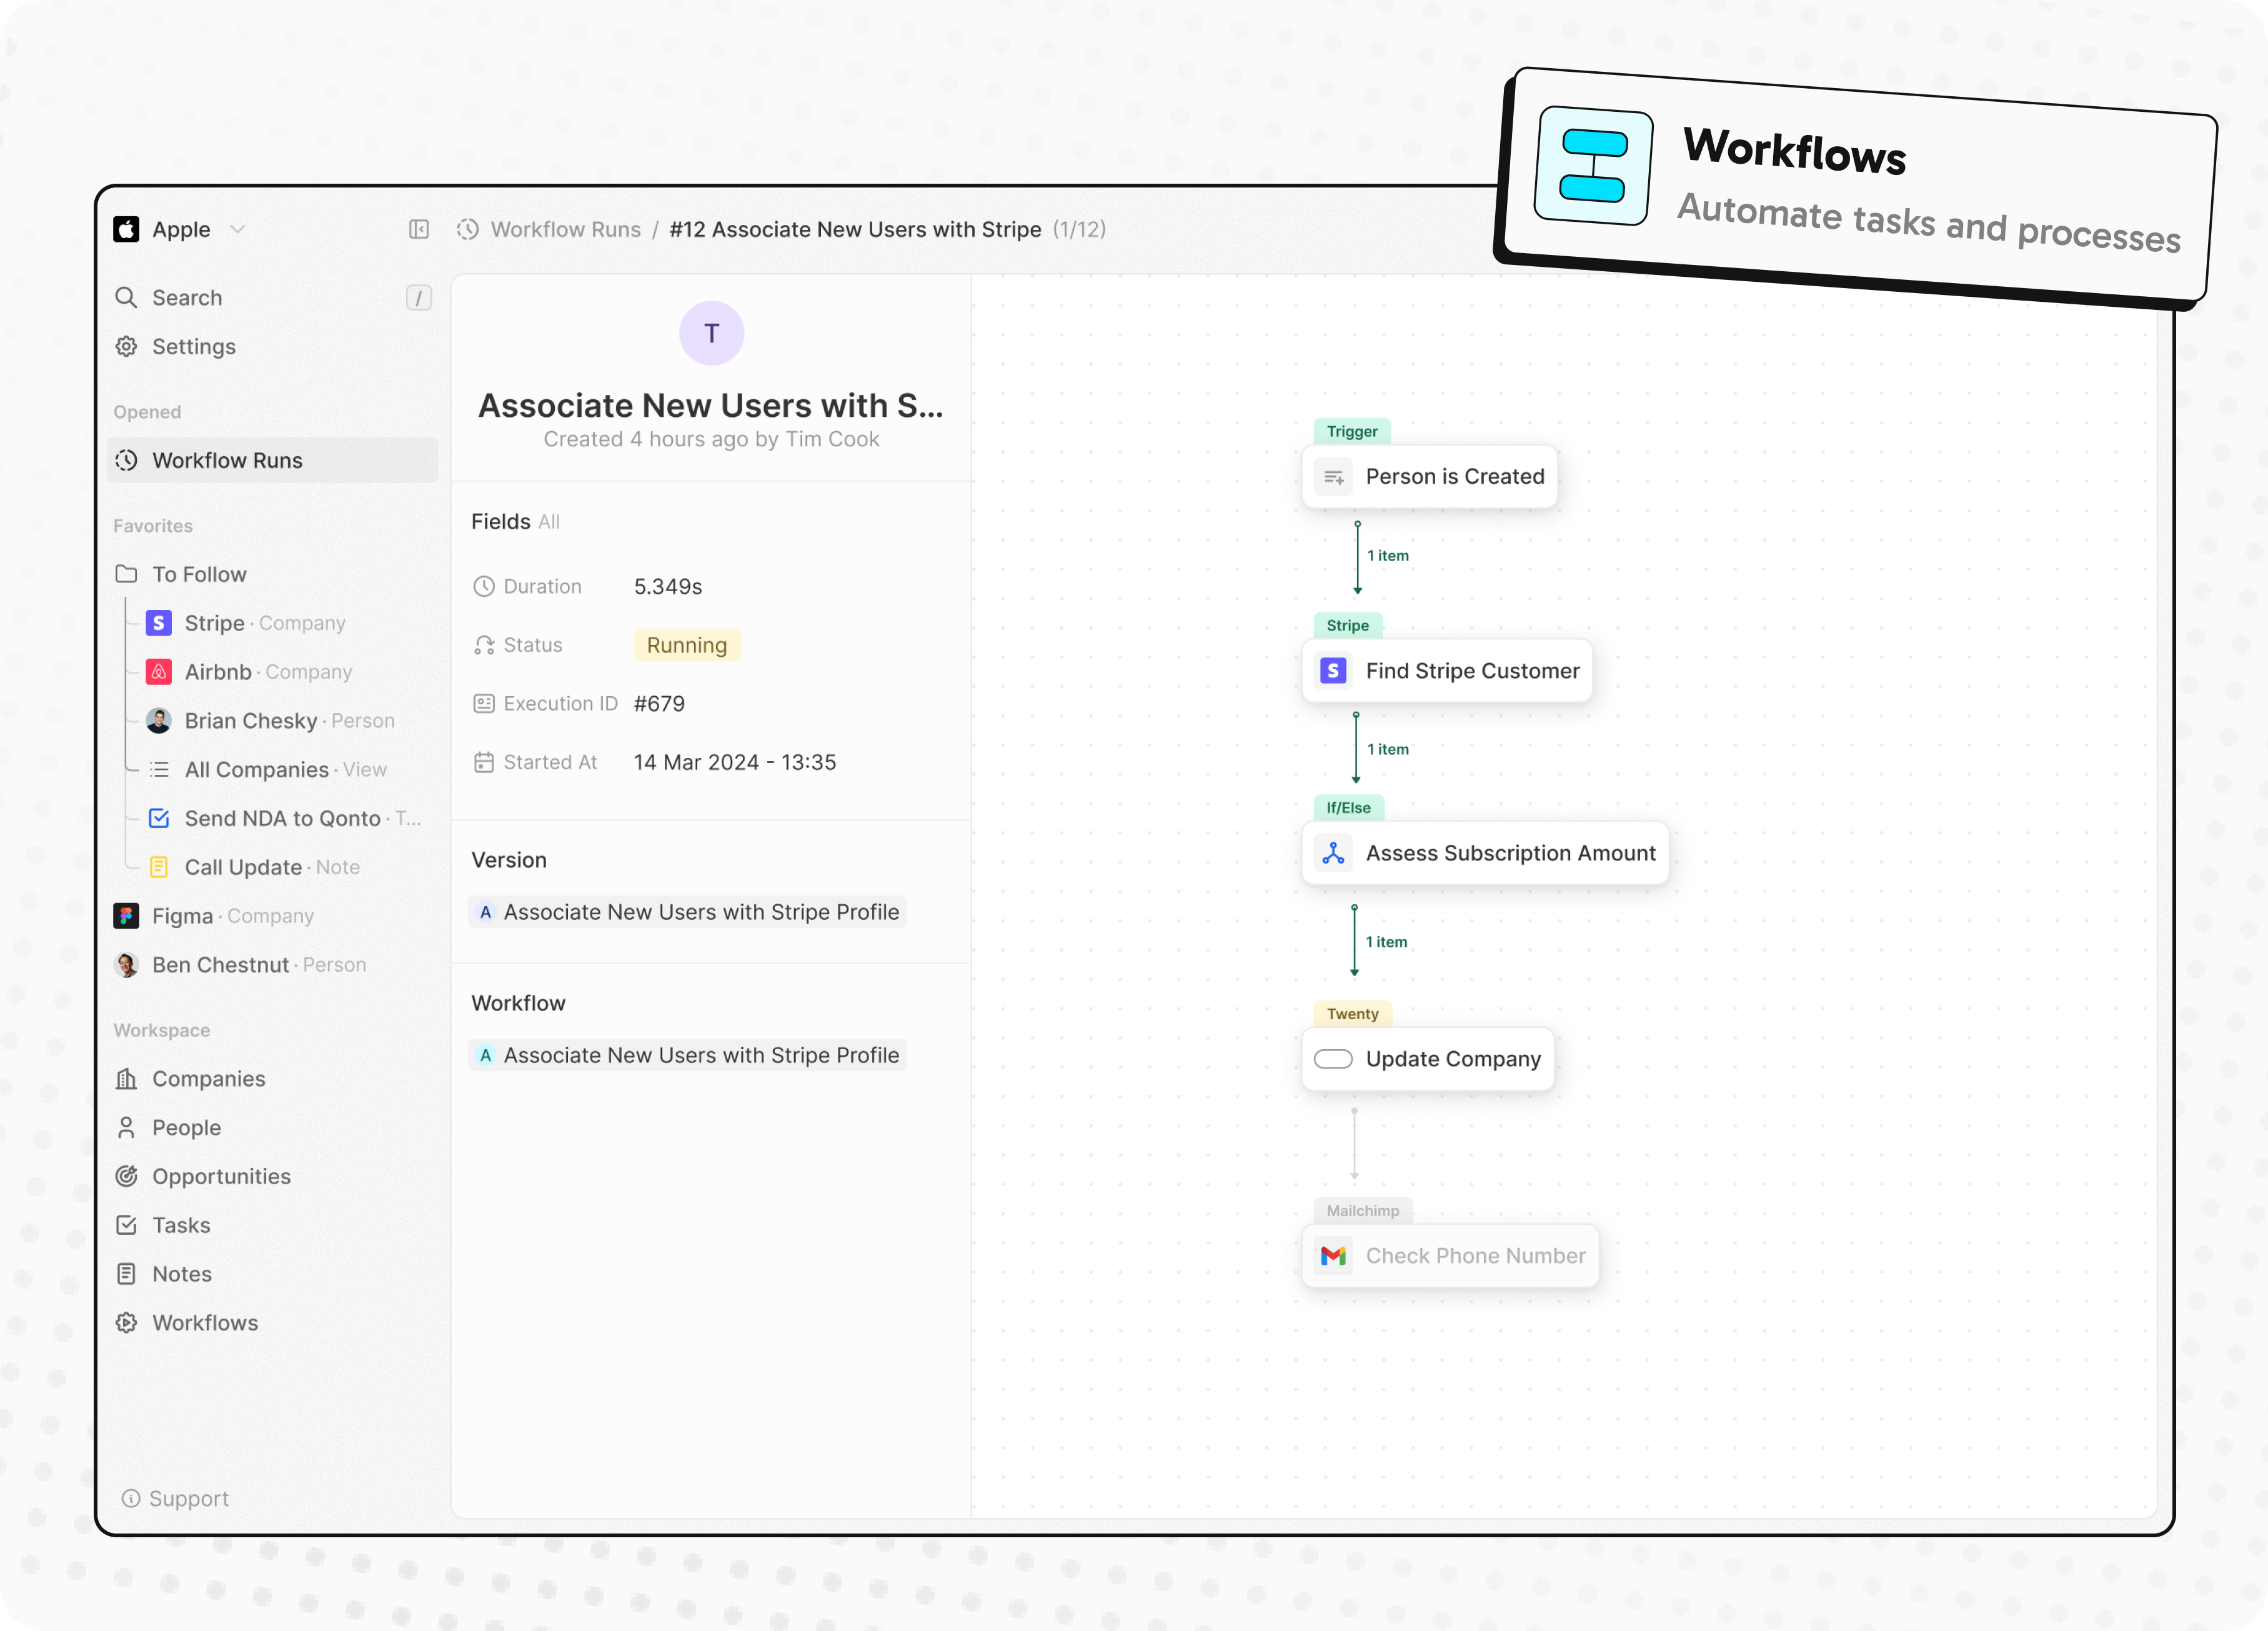
- Automate workflow with triggers and actions
- Emails, calendar events, files, and more
Personalize layouts with filters, sort, group by, kanban and table views
Customize your objects and fields
Create and manage permissions with custom roles

Automate workflow with triggers and actions
Emails, calendar events, files, and more

Stack
- TypeScript
- Nx
- NestJS, with BullMQ, PostgreSQL, Redis
- React, with Recoil, Emotion and Lingui
Thanks
![]()
![]()
![]()
![]()
Thanks to these amazing services that we use and recommend for UI testing (Chromatic), code review (Greptile), catching bugs (Sentry) and translating (Crowdin).
Join the Community
- Star the repo
- Subscribe to releases (watch -> custom -> releases)
- Follow us on Twitter or LinkedIn
- Join our Discord
- Improve translations on Crowdin
- Contributions are, of course, most welcome!
Turso Database is a project to build the next evolution of SQLite.

Turso Database
Turso Database is an in-process SQL database, compatible with SQLite.


![]()


Features and Roadmap
Turso Database is a work-in-progress, in-process OLTP database engine library written in Rust that has:
- SQLite compatibility [doc] for SQL dialect, file formats, and the C API
- Language bindings for JavaScript/WebAssembly, Rust, Go, Python, and Java
- Asynchronous I/O support on Linux with
io_uring - OS support for Linux, macOS, and Windows
In the future, we will be also working on:
BEGIN CONCURRENTfor improved write throughput.- Indexing for vector search.
- Improved schema management including better
ALTERsupport and strict column types by default.
Getting Started
Please see the Turso Database Manual for more information.
💻 Command Line
You can install the latest `turso` release with:
curl --proto '=https' --tlsv1.2 -LsSf \
  https://github.com/tursodatabase/turso/releases/latest/download/turso_cli-installer.sh | sh
Then launch the shell to execute SQL statements:
Turso
Enter ".help" for usage hints.
Connected to a transient in-memory database.
Use ".open FILENAME" to reopen on a persistent database
turso> CREATE TABLE users (id INT PRIMARY KEY, username TEXT);
turso> INSERT INTO users VALUES (1, 'alice');
turso> INSERT INTO users VALUES (2, 'bob');
turso> SELECT * FROM users;
1|alice
2|bob
You can also build and run the latest development version with:
cargo run
🦀 Rust
cargo add turso
Example usage:
let db = Builder::new_local("sqlite.db").build().await?;
let conn = db.connect()?;

let res = conn.query("SELECT * FROM users", ()).await?;
✨ JavaScript
npm i @tursodatabase/turso
Example usage:
import { Database } from '@tursodatabase/turso';

const db = new Database('sqlite.db');
const stmt = db.prepare('SELECT * FROM users');
const users = stmt.all();
console.log(users);
🐍 Python
pip install pyturso
Example usage:
import turso

con = turso.connect("sqlite.db")
cur = con.cursor()
res = cur.execute("SELECT * FROM users")
print(res.fetchone())
🐹 Go
- Clone the repository
- Build the library and set your LD_LIBRARY_PATH to include turso's target directory
cargo build --package limbo-go
export LD_LIBRARY_PATH=/path/to/limbo/target/debug:$LD_LIBRARY_PATH
- Use the driver
go get github.com/tursodatabase/turso
go install github.com/tursodatabase/turso
Example usage:
import (
    "database/sql"
    _ "github.com/tursodatabase/turso"
)

conn, _ = sql.Open("sqlite3", "sqlite.db")
defer conn.Close()

stmt, _ := conn.Prepare("select * from users")
defer stmt.Close()

rows, _ = stmt.Query()
for rows.Next() {
    var id int
    var username string
    _ := rows.Scan(&id, &username)
    fmt.Printf("User: ID: %d, Username: %s\n", id, username)
}
☕️ Java
We integrated Turso Database into JDBC. For detailed instructions on how to use Turso Database with java, please refer to the README.md under bindings/java.
Contributing
We'd love to have you contribute to Turso Database! Please check out the contribution guide to get started.
FAQ
Is Turso Database ready for production use?
Turso Database is currently under heavy development and is not ready for production use.
How is Turso Database different from Turso's libSQL?
Turso Database is a project to build the next evolution of SQLite in Rust, with a strong open contribution focus and features like native async support, vector search, and more. The libSQL project is also an attempt to evolve SQLite in a similar direction, but through a fork rather than a rewrite.
Rewriting SQLite in Rust started as an unassuming experiment, and due to its incredible success, replaces libSQL as our intended direction. At this point, libSQL is production ready, Turso Database is not - although it is evolving rapidly. More details here.
Publications
- Pekka Enberg, Sasu Tarkoma, Jon Crowcroft Ashwin Rao (2024). Serverless Runtime / Database Co-Design With Asynchronous I/O. In EdgeSys ‘24. [PDF]
- Pekka Enberg, Sasu Tarkoma, and Ashwin Rao (2023). Towards Database and Serverless Runtime Co-Design. In CoNEXT-SW ’23. [PDF] [Slides]
License
This project is licensed under the MIT license.
Contribution
Unless you explicitly state otherwise, any contribution intentionally submitted for inclusion in Turso Database by you, shall be licensed as MIT, without any additional terms or conditions.
Partners
Thanks to all the partners of Turso!


Contributors
Thanks to all the contributors to Turso Database!
An open source graphics editor for 2025: comprehensive 2D content creation tool suite for graphic design, digital art, and interactive real-time motion graphics — featuring node-based procedural editing
Your procedural toolbox for 2D content creation
Graphite is a free, open source vector and raster graphics engine, available now in alpha. Get creative with a fully nondestructive editing workflow that combines layer-based compositing with node-based generative design.
Having begun life as a vector editor, Graphite continues evolving into a generalized, all-in-one graphics toolbox that's built more like a game engine than a conventional creative app. The editor's tools wrap its node graph core, providing user-friendly workflows for vector, raster, and beyond. Photo editing, motion graphics, digital painting, desktop publishing, and VFX compositing are additional competencies on the planned roadmap making Graphite into a highly versatile content creation tool.
Learn more from the website, subscribe to the newsletter, consider volunteering or donating, and remember to give this repository a ⭐!
https://github.com/user-attachments/assets/f4604aea-e8f1-45ce-9218-46ddc666f11d
Support our mission ❤️
Graphite is 100% community built and funded. Please become a part of keeping the project alive and thriving with a donation if you share a belief in our mission:
Graphite strives to unshackle the creativity of every budding artist and seasoned professional by building the best comprehensive art and design tool that's accessible to all.
Mission success will come when Graphite is an industry standard. A cohesive product vision and focus on innovation over imitation is the strategy that will make that possible.
Screenshots
Contributing/building the code
Are you a graphics programmer or Rust developer? Graphite aims to be one of the most approachable projects for putting your engineering skills to use in the world of open source. See instructions here for setting up the project and getting started.
By submitting code for inclusion in the project, you are agreeing to license your changes under the Apache 2.0 license, and that you have the authority to do so. Some directories may have other licenses, like dual-licensed MIT/Apache 2.0, and code submissions to those directories mean you agree to the applicable license(s).
Scira (Formerly MiniPerplx) is a minimalistic AI-powered search engine that helps you find information on the internet and cites it too. Powered by Vercel AI SDK! Search with models like xAI's Grok 3.
Scira
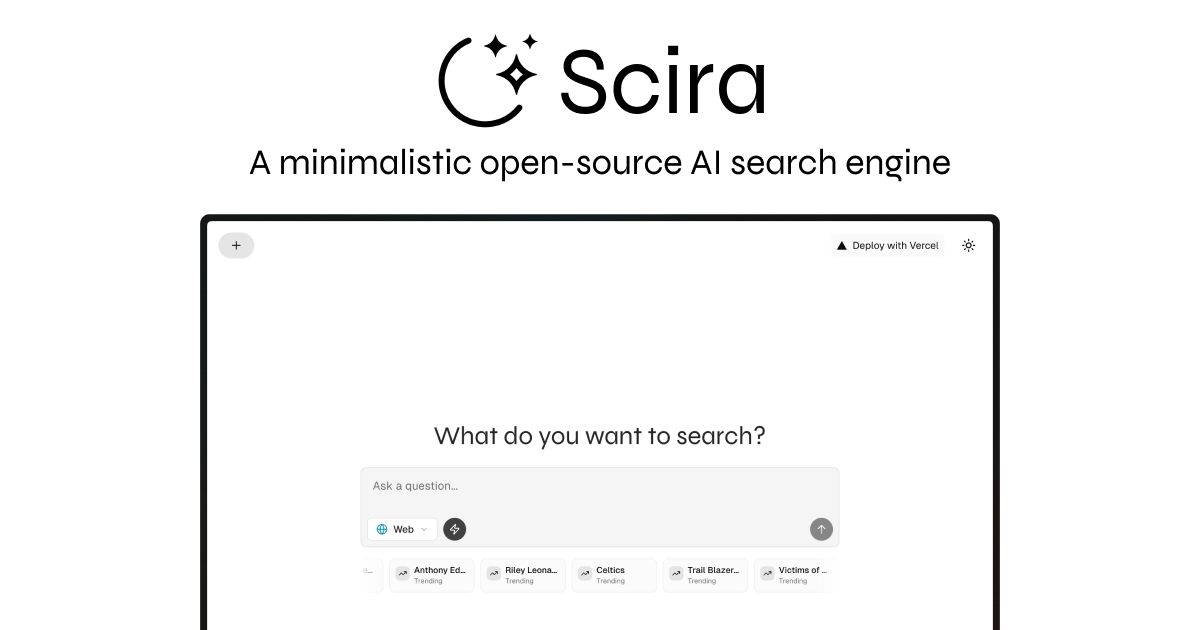
A minimalistic AI-powered search engine that helps you find information on the internet.
![]()
Powered By
- Vercel AI SDK - For AI model integration and streaming
- Tavily AI - For search grounding and web search capabilities
Special Thanks
Features
Core Search & Information
- AI-powered search: Get answers to your questions using multiple AI models including xAI's Grok, Anthropic's Claude, Google's Gemini, and OpenAI's GPT models
- Web search: Search the web using Tavily's API with support for multiple queries, search depths, and topics
- URL content retrieval: Extract and analyze content from any URL using Exa AI with live crawling capabilities
- Reddit search: Search Reddit content with time range filtering using Tavily API
- X (Twitter) search: Search X posts with date ranges and specific handle filtering using xAI Live Search
- Extreme search: Advanced multi-step search capability for complex queries
Academic & Research
- Academic search: Search for academic papers and research using Exa AI with abstracts and summaries
- YouTube search: Find YouTube videos with detailed information, captions, and timestamps powered by Exa AI
Entertainment & Media
- Movie & TV show search: Get detailed information about movies and TV shows using TMDB API
- Trending movies: Discover trending movies with cast, ratings, and detailed information
- Trending TV shows: Find popular TV shows with comprehensive metadata
Financial & Data Analysis
- Stock charts: Generate interactive stock charts with news integration using yfinance and Tavily
- Currency converter: Convert between currencies with real-time exchange rates using yfinance
- Code interpreter: Write and execute Python code with chart generation capabilities using Daytona sandbox
Location & Travel
- Weather information: Get current weather and forecasts for any location using OpenWeather API
- Maps & geocoding: Find places and get coordinates using Google Maps API
- Nearby places search: Discover nearby restaurants, attractions, and services with Google Places API
- Flight tracking: Track real-time flight information using Aviation Stack API
Productivity & Utilities
- Text translation: Translate text between languages using AI models
- Date & time: Get current date and time in user's timezone with multiple format options
- Memory management: Add and search personal memories using Mem0 AI
- MCP server search: Search for Model Context Protocol servers using Smithery Registry
Search Groups
- Web: Search across the entire internet powered by Tavily
- Memory: Your personal memory companion (requires authentication)
- Analysis: Code execution, stock charts, and currency conversion
- Chat: Direct conversation with AI models
- X: Search X (Twitter) posts
- Reddit: Search Reddit posts
- Academic: Search academic papers powered by Exa
- YouTube: Search YouTube videos powered by Exa
- Extreme: Deep research with multiple sources and analysis
LLM Models Supported
- xAI: Grok 3, Grok 3 Mini, Grok 2 Vision
- Google: Gemini 2.5 Flash (Preview), Gemini 2.5 Pro (Preview)
- Anthropic: Claude 4 Sonnet, Claude 4 Opus (with thinking capabilities)
- OpenAI: GPT-4o, o4-mini, o3 (with reasoning capabilities)
- Groq: Qwen QwQ 32B, Qwen 3 32B, Meta's Llama 4 Maverick
Built with
- Next.js - React framework
- Tailwind CSS - Styling
- Vercel AI SDK - AI model integration
- Shadcn/UI - UI components
- Exa.AI - Web search and content retrieval
- Tavily - Search grounding
- OpenWeather - Weather data
- Daytona - Code execution sandbox
- Google Maps - Location services
- Aviation Stack - Flight tracking
- TMDB - Movie and TV data
- Mem0 - Memory management
- Better Auth - Authentication
- Drizzle ORM - Database management
Deploy your own
Set Scira as your default search engine
-
Open the Chrome browser settings:
- Click on the three vertical dots in the upper right corner of the browser.
- Select "Settings" from the dropdown menu.
-
Go to the search engine settings:
- In the left sidebar, click on "Search engine."
- Then select "Manage search engines and site search."
-
Add a new search engine:
- Click on "Add" next to "Site search."
-
Set the search engine name:
- Enter
Scirain the "Search engine" field.
- Enter
-
Set the search engine URL:
- Enter
https://scira.ai?q=%sin the "URL with %s in place of query" field.
- Enter
-
Set the search engine shortcut:
- Enter
shin the "Shortcut" field.
- Enter
-
Set Default:
- Click on the three dots next to the search engine you just added.
- Select "Make default" from the dropdown menu.
After completing these steps, you should be able to use Scira as your default search engine in Chrome.
Local development
Run via Docker
The application can be run using Docker in two ways:
Using Docker Compose (Recommended)
- Make sure you have Docker and Docker Compose installed on your system
- Create a
.envfile based on.env.examplewith your API keys - Run the following command in the project root:
docker compose up - The application will be available at
http://localhost:3000
Using Docker Directly
- Create a
.envfile based on.env.examplewith your API keys - Build the Docker image:
docker build -t scira.app . - Run the container:
docker run --env-file .env -p 3000:3000 scira.app
The application uses a multi-stage build process to minimize the final image size and implements security best practices. The production image runs on Node.js LTS with Alpine Linux for a minimal footprint.
Run with Node.js
To run the application locally without Docker:
- Sign up for accounts with the required AI providers:
- OpenAI (required)
- Anthropic (required)
- Tavily (required for web search feature)
- Copy
.env.exampleto.env.localand fill in your API keys - Install dependencies:
pnpm install - Start the development server:
pnpm dev - Open
http://localhost:3000in your browser
License
This project is licensed under the Apache 2.0 License - see the LICENSE file for details.
Invoicing, Time tracking, File reconciliation, Storage, Financial Overview & your own Assistant made for Freelancers

Midday
Run your business smarter
Discord · Website · Issues
About Midday
Midday is an all-in-one tool designed to help freelancers, contractors, consultants, and solo entrepreneurs manage their business operations more efficiently. It integrates various functions typically scattered across multiple platforms into a single, cohesive system.
Features
Time Tracking: Allows for live time tracking of projects to boost productivity and collaboration, providing insightful project overviews.
Invoicing: An upcoming feature that will enable users to create web-based invoices, collaborate in real-time, and synchronize projects seamlessly.
Magic Inbox: Automatically matches incoming invoices or receipts to the correct transactions, simplifying financial tracking and organization.
Vault: Secure storage for important files like contracts and agreements, keeping everything in one place for easy access.
Seamless Export: Facilitates easy export of financial data, packaged neatly in CSV files for accountants.
Assistant: Provides tailored insights into financial situations, helping users understand spending patterns, cut costs, and find documents.
Recognition

Get started
We are working on the documentation to get started with Midday for local development: https://docs.midday.ai
App Architecture
- Monorepo
- Bun
- React
- TypeScript
- Nextjs
- Supabase
- Shadcn
- Tauri
- Expo
- TailwindCSS
Hosting
- Supabase (database, storage, realtime, auth)
- Vercel (Website, Dashboard)
- Fly.io (API/tRPC)
Services
- Trigger.dev (background jobs)
- Resend (Transactional & Marketing)
- Novu (notifications)
- Github Actions (CI/CD)
- GoCardLess (Bank connection EU)
- Plaid (Bank connection in Canada and US)
- Teller (Bank connection in the US)
- OpenPanel (Events and Analytics)
- Polar (Payment processing)
- Typesense (Search)
- Mistral
- OpenAI
Repo Activity

License
This project is licensed under the AGPL-3.0 for non-commercial use.
Commercial Use
For commercial use or deployments requiring a setup fee, please contact us for a commercial license at [email protected].
By using this software, you agree to the terms of the license.
21 Lessons, Get Started Building with Generative AI 🔗 https://microsoft.github.io/generative-ai-for-beginners/
21 Lessons teaching everything you need to know to start building Generative AI applications


![]()


🌐 Multi-Language Support
Supported via GitHub Action (Automated & Always Up-to-Date)
French | Spanish | German | Russian | Arabic | Persian (Farsi) | Urdu | Chinese (Simplified) | Chinese (Traditional, Macau) | Chinese (Traditional, Hong Kong) | Chinese (Traditional, Taiwan) | Japanese | Korean | Hindi | Bengali | Marathi | Nepali | Punjabi (Gurmukhi) | Portuguese (Portugal) | Portuguese (Brazil) | Italian | Polish | Turkish | Greek | Thai | Swedish | Danish | Norwegian | Finnish | Dutch | Hebrew | Vietnamese | Indonesian | Malay | Tagalog (Filipino) | Swahili | Hungarian | Czech | Slovak | Romanian | Bulgarian | Serbian (Cyrillic) | Croatian | Slovenian
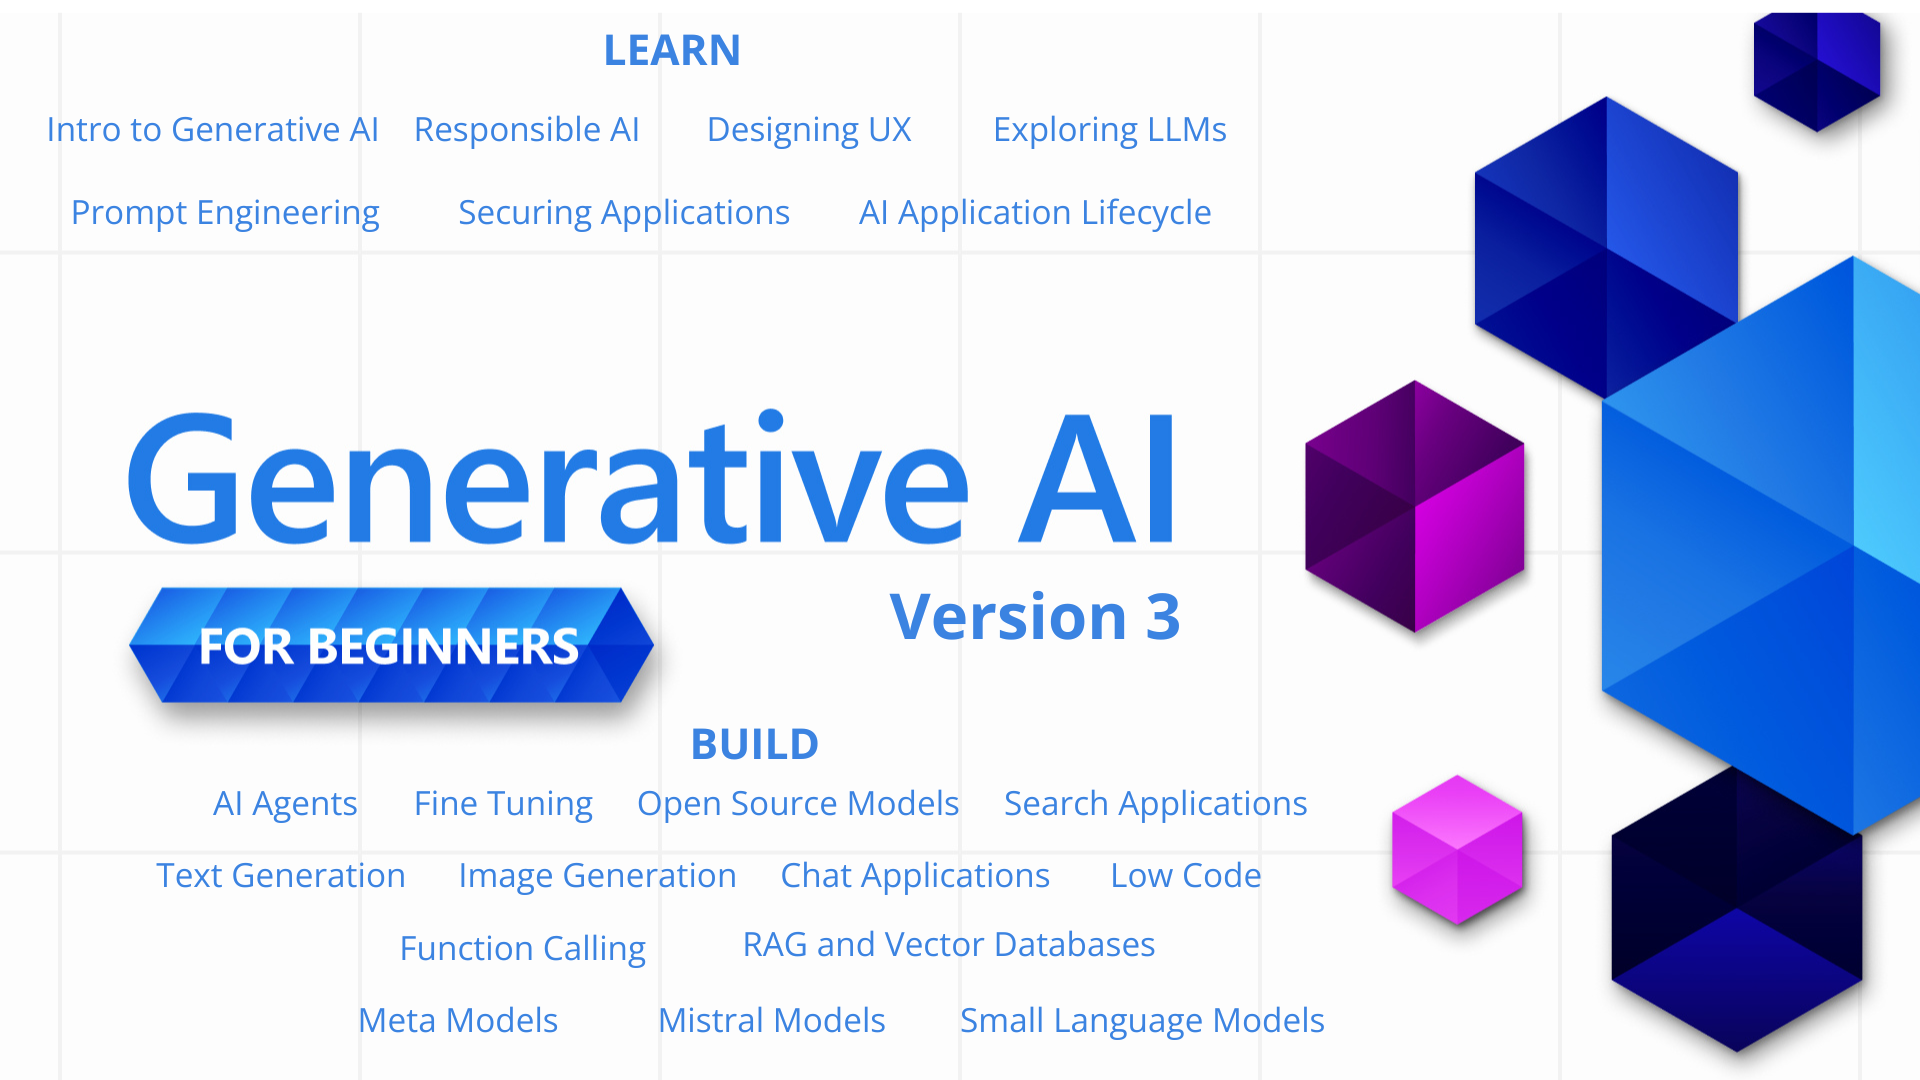
Generative AI for Beginners (Version 3) - A Course
Learn the fundamentals of building Generative AI applications with our 21-lesson comprehensive course by Microsoft Cloud Advocates.
🌱 Getting Started
This course has 21 lessons. Each lesson covers its own topic so start wherever you like!
Lessons are labeled either "Learn" lessons explaining a Generative AI concept or "Build" lessons that explain a concept and code examples in both Python and TypeScript when possible.
For .NET Developers checkout Generative AI for Beginners (.NET Edition)!
Each lesson also includes a "Keep Learning" section with additional learning tools.
What You Need
To run the code of this course, you can use either:
-
Azure OpenAI Service - Lessons: "aoai-assignment"
-
GitHub Marketplace Model Catalog - Lessons: "githubmodels"
-
OpenAI API - Lessons: "oai-assignment"
-
Basic knowledge of Python or TypeScript is helpful - *For absolute beginners check out these Python and TypeScript courses
-
A GitHub account to fork this entire repo to your own GitHub account
We have created a Course Setup lesson to help you with setting up your development environment.
Don't forget to star (🌟) this repo to find it easier later.
🧠 Ready to Deploy?
If you are looking for more advanced code samples, check out our collection of Generative AI Code Samples in both Python and TypeScript.
🗣️ Meet Other Learners, Get Support
Join our official Azure AI Foundry Discord server to meet and network with other learners taking this course and get support.
Ask questions or share product feedback in our Azure AI Foundry Developer Forum on Github.
🚀 Building a Startup?
Sign up for Microsoft for Startups Founders Hub to receive free OpenAI credits and up to $150k towards Azure credits to access OpenAI models through Azure OpenAI Services.
🙏 Want to help?
Do you have suggestions or found spelling or code errors? Raise an issue or Create a pull request
📂 Each lesson includes:
- A short video introduction to the topic
- A written lesson located in the README
- Python and TypeScript code samples supporting Azure OpenAI and OpenAI API
- Links to extra resources to continue your learning
🗃️ Lessons
| # | Lesson Link | Description | Video | Extra Learning |
|---|---|---|---|---|
| 00 | Course Setup | Learn: How to Setup Your Development Environment | Video Coming Soon | Learn More |
| 01 | Introduction to Generative AI and LLMs | Learn: Understanding what Generative AI is and how Large Language Models (LLMs) work. | Video | Learn More |
| 02 | Exploring and comparing different LLMs | Learn: How to select the right model for your use case | Video | Learn More |
| 03 | Using Generative AI Responsibly | Learn: How to build Generative AI Applications responsibly | Video | Learn More |
| 04 | Understanding Prompt Engineering Fundamentals | Learn: Hands-on Prompt Engineering Best Practices | Video | Learn More |
| 05 | Creating Advanced Prompts | Learn: How to apply prompt engineering techniques that improve the outcome of your prompts. | Video | Learn More |
| 06 | Building Text Generation Applications | Build: A text generation app using Azure OpenAI / OpenAI API | Video | Learn More |
| 07 | Building Chat Applications | Build: Techniques for efficiently building and integrating chat applications. | Video | Learn More |
| 08 | Building Search Apps Vector Databases | Build: A search application that uses Embeddings to search for data. | Video | Learn More |
| 09 | Building Image Generation Applications | Build: An image generation application | Video | Learn More |
| 10 | Building Low Code AI Applications | Build: A Generative AI application using Low Code tools | Video | Learn More |
| 11 | Integrating External Applications with Function Calling | Build: What is function calling and its use cases for applications | Video | Learn More |
| 12 | Designing UX for AI Applications | Learn: How to apply UX design principles when developing Generative AI Applications | Video | Learn More |
| 13 | Securing Your Generative AI Applications | Learn: The threats and risks to AI systems and methods to secure these systems. | Video | Learn More |
| 14 | The Generative AI Application Lifecycle | Learn: The tools and metrics to manage the LLM Lifecycle and LLMOps | Video | Learn More |
| 15 | Retrieval Augmented Generation (RAG) and Vector Databases | Build: An application using a RAG Framework to retrieve embeddings from a Vector Databases | Video | Learn More |
| 16 | Open Source Models and Hugging Face | Build: An application using open source models available on Hugging Face | Video | Learn More |
| 17 | AI Agents | Build: An application using an AI Agent Framework | Video | Learn More |
| 18 | Fine-Tuning LLMs | Learn: The what, why and how of fine-tuning LLMs | Video | Learn More |
| 19 | Building with SLMs | Learn: The benefits of building with Small Language Models | Video Coming Soon | Learn More |
| 20 | Building with Mistral Models | Learn: The features and differences of the Mistral Family Models | Video Coming Soon | Learn More |
| 21 | Building with Meta Models | Learn: The features and differences of the Meta Family Models | Video Coming Soon | Learn More |
🌟 Special thanks
Special thanks to John Aziz for creating all of the GitHub Actions and workflows
Bernhard Merkle for making key contributions to each lesson to improve the learner and code experience.
🎒 Other Courses
Our team produces other courses! Check out:
- NEW Model Context Protocol for Beginners
- AI Agents for Beginners
- Generative AI for Beginners using .NET
- Generative AI for Beginners using JavaScript
- ML for Beginners
- Data Science for Beginners
- AI for Beginners
- Cybersecurity for Beginners
- Web Dev for Beginners
- IoT for Beginners
- XR Development for Beginners
- Mastering GitHub Copilot for AI Paired Programming
- Mastering GitHub Copilot for C#/.NET Developers
- Choose Your Own Copilot Adventure
An LLM-powered knowledge curation system that researches a topic and generates a full-length report with citations.
![]()
STORM: Synthesis of Topic Outlines through Retrieval and Multi-perspective Question Asking
| Research preview | STORM Paper| Co-STORM Paper | Website |
**Latest News** 🔥-
[2025/01] We add litellm integration for language models and embedding models in
knowledge-stormv1.1.0. -
[2024/09] Co-STORM codebase is now released and integrated into
knowledge-stormpython package v1.0.0. Runpip install knowledge-storm --upgradeto check it out. -
[2024/09] We introduce collaborative STORM (Co-STORM) to support human-AI collaborative knowledge curation! Co-STORM Paper has been accepted to EMNLP 2024 main conference.
-
[2024/07] You can now install our package with
pip install knowledge-storm! -
[2024/07] We add
VectorRMto support grounding on user-provided documents, complementing existing support of search engines (YouRM,BingSearch). (check out #58) -
[2024/07] We release demo light for developers a minimal user interface built with streamlit framework in Python, handy for local development and demo hosting (checkout #54)
-
[2024/06] We will present STORM at NAACL 2024! Find us at Poster Session 2 on June 17 or check our presentation material.
-
[2024/05] We add Bing Search support in rm.py. Test STORM with
GPT-4o- we now configure the article generation part in our demo usingGPT-4omodel. -
[2024/04] We release refactored version of STORM codebase! We define interface for STORM pipeline and reimplement STORM-wiki (check out
src/storm_wiki) to demonstrate how to instantiate the pipeline. We provide API to support customization of different language models and retrieval/search integration.
![]()
Overview (Try STORM now!)

While the system cannot produce publication-ready articles that often require a significant number of edits, experienced Wikipedia editors have found it helpful in their pre-writing stage.
More than 70,000 people have tried our live research preview. Try it out to see how STORM can help your knowledge exploration journey and please provide feedback to help us improve the system 🙏!
How STORM & Co-STORM works
STORM
STORM breaks down generating long articles with citations into two steps:
- Pre-writing stage: The system conducts Internet-based research to collect references and generates an outline.
- Writing stage: The system uses the outline and references to generate the full-length article with citations.
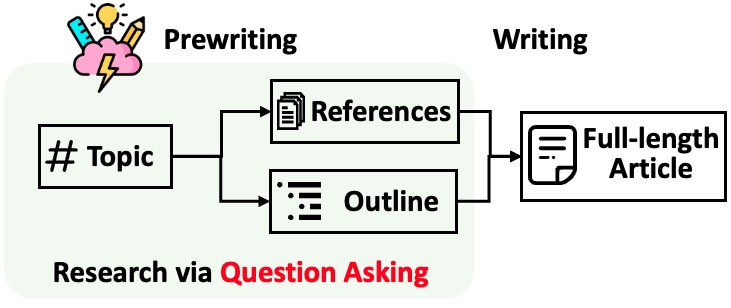
STORM identifies the core of automating the research process as automatically coming up with good questions to ask. Directly prompting the language model to ask questions does not work well. To improve the depth and breadth of the questions, STORM adopts two strategies:
- Perspective-Guided Question Asking: Given the input topic, STORM discovers different perspectives by surveying existing articles from similar topics and uses them to control the question-asking process.
- Simulated Conversation: STORM simulates a conversation between a Wikipedia writer and a topic expert grounded in Internet sources to enable the language model to update its understanding of the topic and ask follow-up questions.
CO-STORM
Co-STORM proposes a collaborative discourse protocol which implements a turn management policy to support smooth collaboration among
- Co-STORM LLM experts: This type of agent generates answers grounded on external knowledge sources and/or raises follow-up questions based on the discourse history.
- Moderator: This agent generates thought-provoking questions inspired by information discovered by the retriever but not directly used in previous turns. Question generation can also be grounded!
- Human user: The human user will take the initiative to either (1) observe the discourse to gain deeper understanding of the topic, or (2) actively engage in the conversation by injecting utterances to steer the discussion focus.
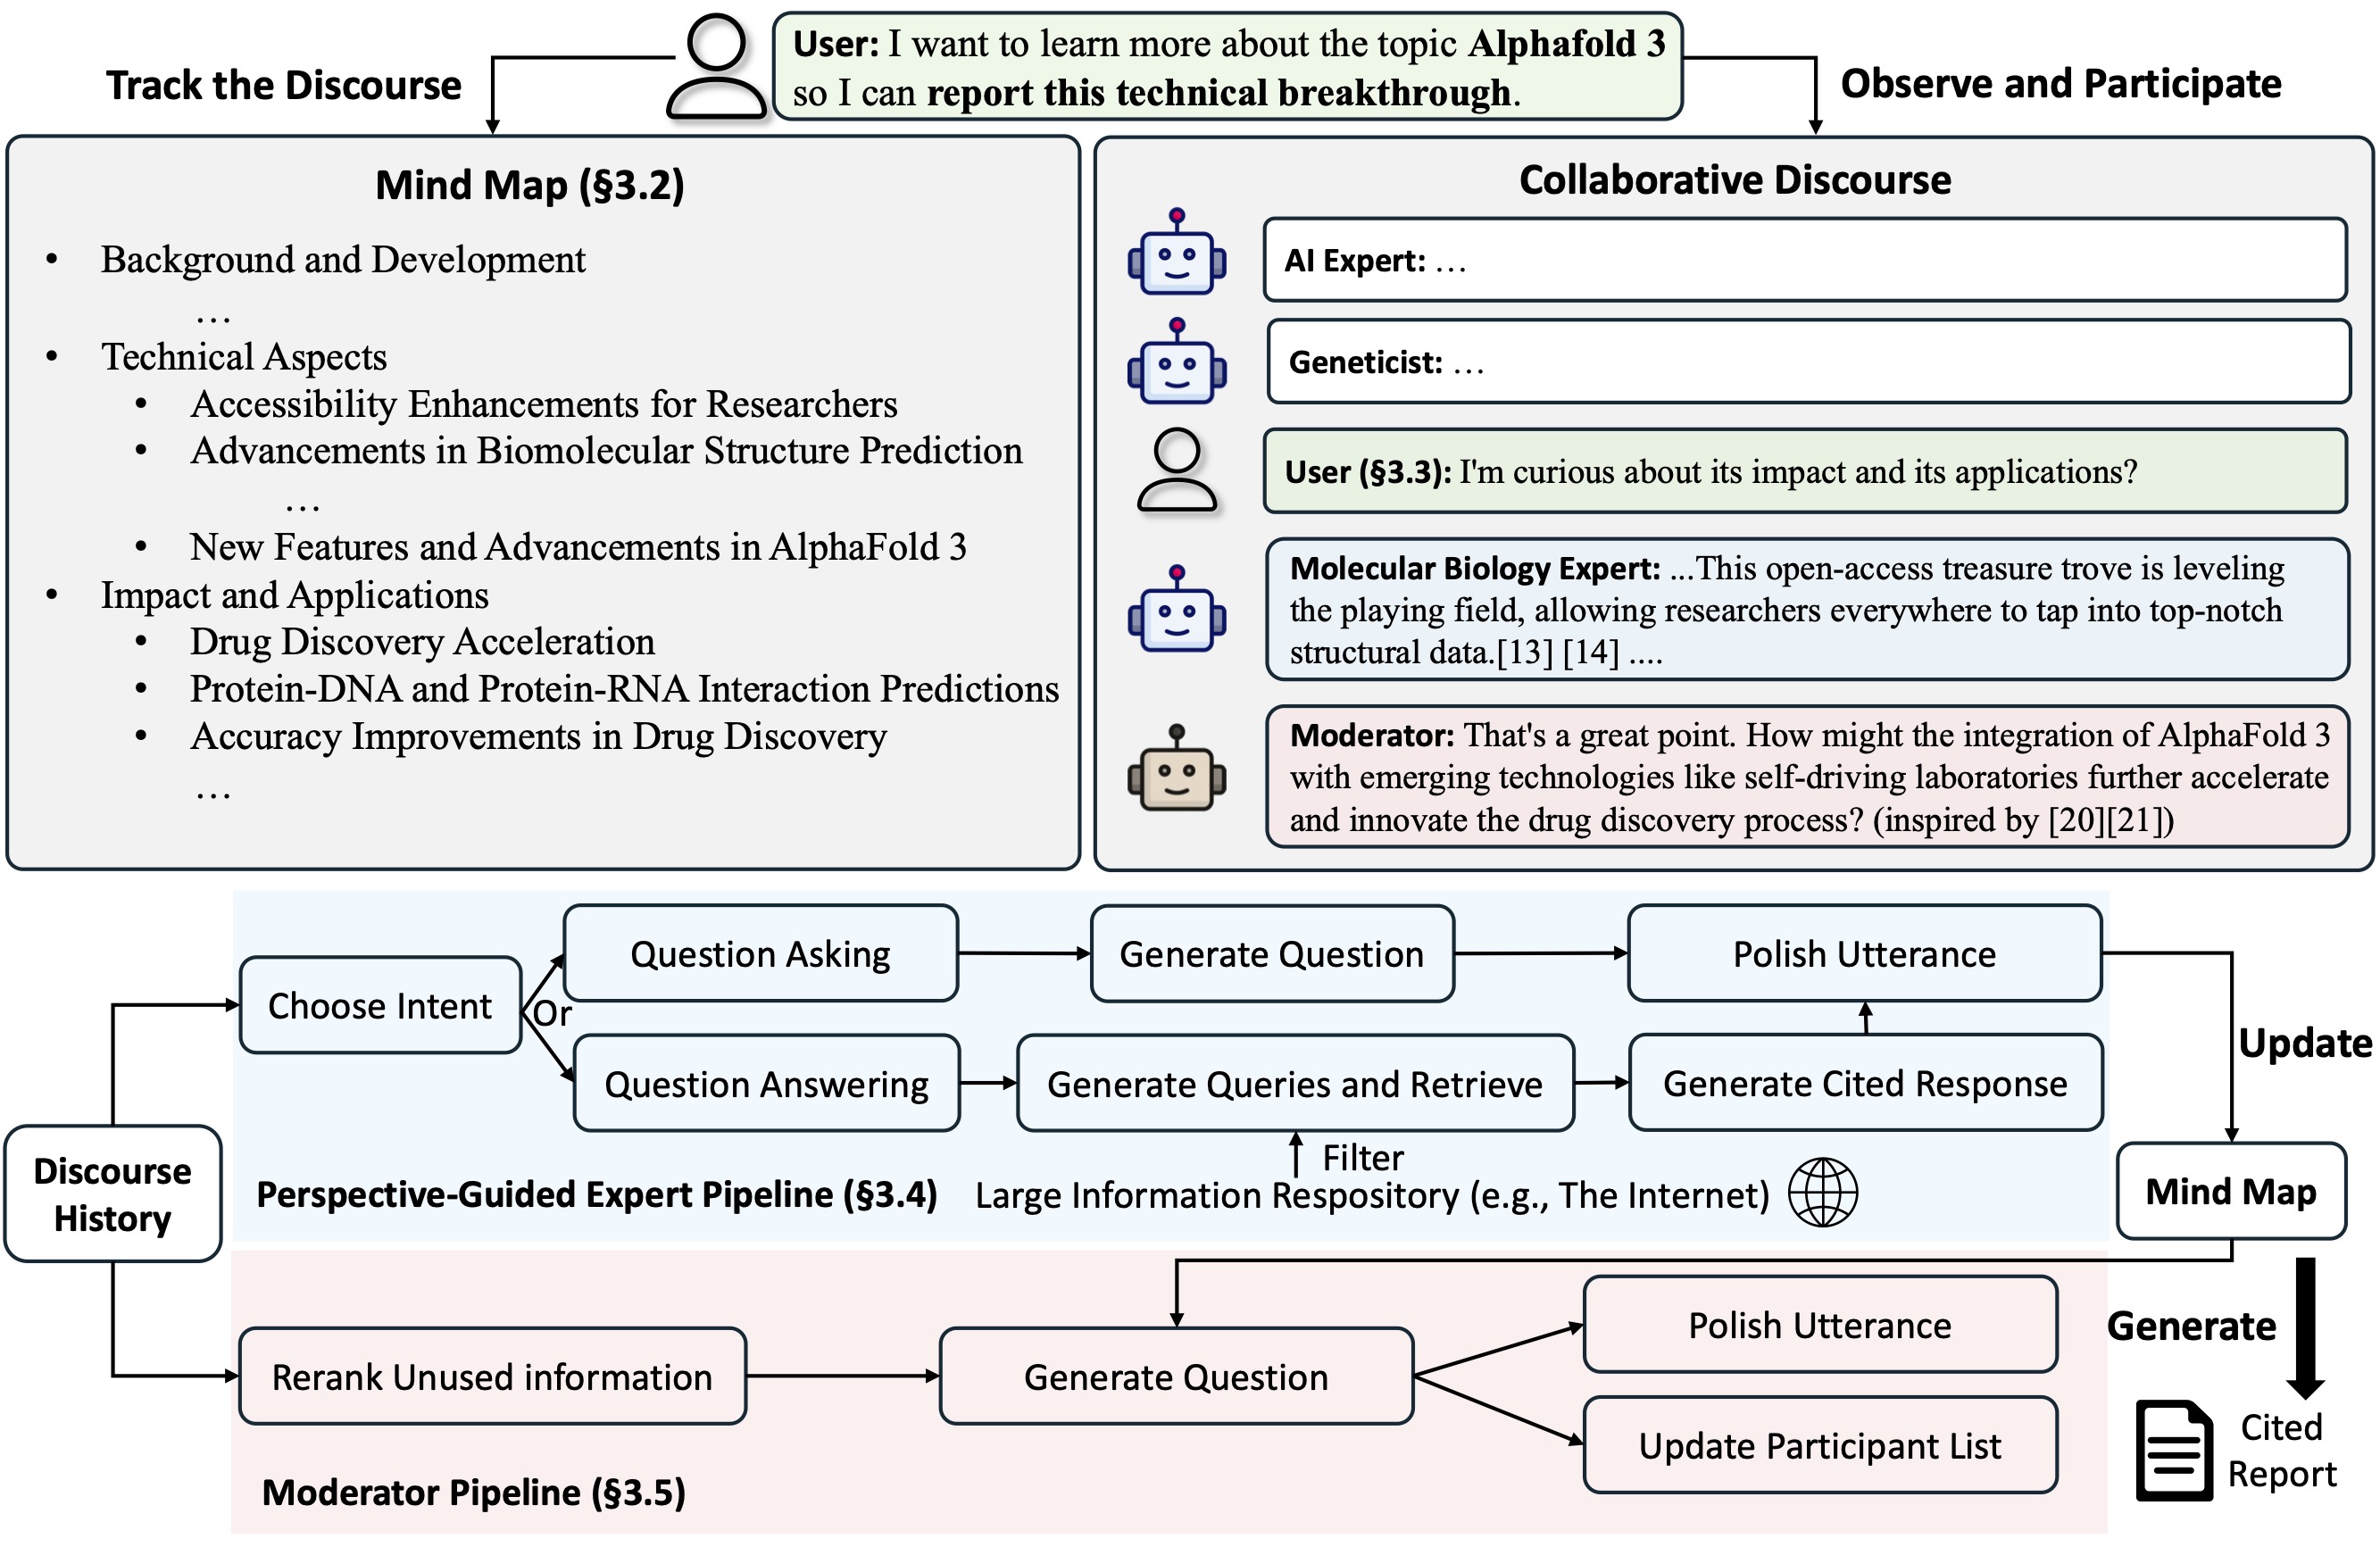
Co-STORM also maintains a dynamic updated mind map, which organize collected information into a hierarchical concept structure, aiming to build a shared conceptual space between the human user and the system. The mind map has been proven to help reduce the mental load when the discourse goes long and in-depth.
Both STORM and Co-STORM are implemented in a highly modular way using dspy.
Installation
To install the knowledge storm library, use pip install knowledge-storm.
You could also install the source code which allows you to modify the behavior of STORM engine directly.
-
Clone the git repository.
git clone https://github.com/stanford-oval/storm.git cd storm -
Install the required packages.
conda create -n storm python=3.11
conda activate storm
pip install -r requirements.txt
API
Currently, our package support:
- Language model components: All language models supported by litellm as listed here
- Embedding model components: All embedding models supported by litellm as listed here
- retrieval module components:
YouRM,BingSearch,VectorRM,SerperRM,BraveRM,SearXNG,DuckDuckGoSearchRM,TavilySearchRM,GoogleSearch, andAzureAISearchas
🌟 PRs for integrating more search engines/retrievers into knowledge_storm/rm.py are highly appreciated!
Both STORM and Co-STORM are working in the information curation layer, you need to set up the information retrieval module and language model module to create their Runner classes respectively.
STORM
The STORM knowledge curation engine is defined as a simple Python STORMWikiRunner class. Here is an example of using You.com search engine and OpenAI models.
import os
from knowledge_storm import STORMWikiRunnerArguments, STORMWikiRunner, STORMWikiLMConfigs
from knowledge_storm.lm import LitellmModel
from knowledge_storm.rm import YouRM

lm_configs = STORMWikiLMConfigs()
openai_kwargs = {
    'api_key': os.getenv("OPENAI_API_KEY"),
    'temperature': 1.0,
    'top_p': 0.9,
}
# STORM is a LM system so different components can be powered by different models to reach a good balance between cost and quality.
# For a good practice, choose a cheaper/faster model for `conv_simulator_lm` which is used to split queries, synthesize answers in the conversation.
# Choose a more powerful model for `article_gen_lm` to generate verifiable text with citations.
gpt_35 = LitellmModel(model='gpt-3.5-turbo', max_tokens=500, **openai_kwargs)
gpt_4 = LitellmModel(model='gpt-4o', max_tokens=3000, **openai_kwargs)
lm_configs.set_conv_simulator_lm(gpt_35)
lm_configs.set_question_asker_lm(gpt_35)
lm_configs.set_outline_gen_lm(gpt_4)
lm_configs.set_article_gen_lm(gpt_4)
lm_configs.set_article_polish_lm(gpt_4)
# Check out the STORMWikiRunnerArguments class for more configurations.
engine_args = STORMWikiRunnerArguments(...)
rm = YouRM(ydc_api_key=os.getenv('YDC_API_KEY'), k=engine_args.search_top_k)
runner = STORMWikiRunner(engine_args, lm_configs, rm)
The STORMWikiRunner instance can be evoked with the simple run method:
topic = input('Topic: ')
runner.run(
    topic=topic,
    do_research=True,
    do_generate_outline=True,
    do_generate_article=True,
    do_polish_article=True,
)
runner.post_run()
runner.summary()
do_research: if True, simulate conversations with difference perspectives to collect information about the topic; otherwise, load the results.do_generate_outline: if True, generate an outline for the topic; otherwise, load the results.do_generate_article: if True, generate an article for the topic based on the outline and the collected information; otherwise, load the results.do_polish_article: if True, polish the article by adding a summarization section and (optionally) removing duplicate content; otherwise, load the results.
Co-STORM
The Co-STORM knowledge curation engine is defined as a simple Python CoStormRunner class. Here is an example of using Bing search engine and OpenAI models.
from knowledge_storm.collaborative_storm.engine import CollaborativeStormLMConfigs, RunnerArgument, CoStormRunner
from knowledge_storm.lm import LitellmModel
from knowledge_storm.logging_wrapper import LoggingWrapper
from knowledge_storm.rm import BingSearch

# Co-STORM adopts the same multi LM system paradigm as STORM
lm_config: CollaborativeStormLMConfigs = CollaborativeStormLMConfigs()
openai_kwargs = {
    "api_key": os.getenv("OPENAI_API_KEY"),
    "api_provider": "openai",
    "temperature": 1.0,
    "top_p": 0.9,
    "api_base": None,
}
question_answering_lm = LitellmModel(model=gpt_4o_model_name, max_tokens=1000, **openai_kwargs)
discourse_manage_lm = LitellmModel(model=gpt_4o_model_name, max_tokens=500, **openai_kwargs)
utterance_polishing_lm = LitellmModel(model=gpt_4o_model_name, max_tokens=2000, **openai_kwargs)
warmstart_outline_gen_lm = LitellmModel(model=gpt_4o_model_name, max_tokens=500, **openai_kwargs)
question_asking_lm = LitellmModel(model=gpt_4o_model_name, max_tokens=300, **openai_kwargs)
knowledge_base_lm = LitellmModel(model=gpt_4o_model_name, max_tokens=1000, **openai_kwargs)

lm_config.set_question_answering_lm(question_answering_lm)
lm_config.set_discourse_manage_lm(discourse_manage_lm)
lm_config.set_utterance_polishing_lm(utterance_polishing_lm)
lm_config.set_warmstart_outline_gen_lm(warmstart_outline_gen_lm)
lm_config.set_question_asking_lm(question_asking_lm)
lm_config.set_knowledge_base_lm(knowledge_base_lm)

# Check out the Co-STORM's RunnerArguments class for more configurations.
topic = input('Topic: ')
runner_argument = RunnerArgument(topic=topic, ...)
logging_wrapper = LoggingWrapper(lm_config)
bing_rm = BingSearch(bing_search_api_key=os.environ.get("BING_SEARCH_API_KEY"),
                     k=runner_argument.retrieve_top_k)
costorm_runner = CoStormRunner(lm_config=lm_config,
                               runner_argument=runner_argument,
                               logging_wrapper=logging_wrapper,
                               rm=bing_rm)
The CoStormRunner instance can be evoked with the warmstart() and step(...) methods.
# Warm start the system to build shared conceptual space between Co-STORM and users
costorm_runner.warm_start()

# Step through the collaborative discourse
# Run either of the code snippets below in any order, as many times as you'd like
# To observe the conversation:
conv_turn = costorm_runner.step()
# To inject your utterance to actively steer the conversation:
costorm_runner.step(user_utterance="YOUR UTTERANCE HERE")

# Generate report based on the collaborative discourse
costorm_runner.knowledge_base.reorganize()
article = costorm_runner.generate_report()
print(article)
Quick Start with Example Scripts
We provide scripts in our examples folder as a quick start to run STORM and Co-STORM with different configurations.
We suggest using secrets.toml to set up the API keys. Create a file secrets.toml under the root directory and add the following content:
# ============ language model configurations ============
# Set up OpenAI API key.
OPENAI_API_KEY="your_openai_api_key"
# If you are using the API service provided by OpenAI, include the following line:
OPENAI_API_TYPE="openai"
# If you are using the API service provided by Microsoft Azure, include the following lines:
OPENAI_API_TYPE="azure"
AZURE_API_BASE="your_azure_api_base_url"
AZURE_API_VERSION="your_azure_api_version"
# ============ retriever configurations ============
BING_SEARCH_API_KEY="your_bing_search_api_key" # if using bing search
# ============ encoder configurations ============
ENCODER_API_TYPE="openai" # if using openai encoder
STORM examples
To run STORM with gpt family models with default configurations:
Run the following command.
python examples/storm_examples/run_storm_wiki_gpt.py \
    --output-dir $OUTPUT_DIR \
    --retriever bing \
    --do-research \
    --do-generate-outline \
    --do-generate-article \
    --do-polish-article
To run STORM using your favorite language models or grounding on your own corpus: Check out examples/storm_examples/README.md.
Co-STORM examples
To run Co-STORM with gpt family models with default configurations,
- Add
BING_SEARCH_API_KEY="xxx"andENCODER_API_TYPE="xxx"tosecrets.toml - Run the following command
python examples/costorm_examples/run_costorm_gpt.py \
    --output-dir $OUTPUT_DIR \
    --retriever bing
Customization of the Pipeline
STORM
If you have installed the source code, you can customize STORM based on your own use case. STORM engine consists of 4 modules:
- Knowledge Curation Module: Collects a broad coverage of information about the given topic.
- Outline Generation Module: Organizes the collected information by generating a hierarchical outline for the curated knowledge.
- Article Generation Module: Populates the generated outline with the collected information.
- Article Polishing Module: Refines and enhances the written article for better presentation.
The interface for each module is defined in knowledge_storm/interface.py, while their implementations are instantiated in knowledge_storm/storm_wiki/modules/*. These modules can be customized according to your specific requirements (e.g., generating sections in bullet point format instead of full paragraphs).
Co-STORM
If you have installed the source code, you can customize Co-STORM based on your own use case
- Co-STORM introduces multiple LLM agent types (i.e. Co-STORM experts and Moderator). LLM agent interface is defined in
knowledge_storm/interface.py, while its implementation is instantiated inknowledge_storm/collaborative_storm/modules/co_storm_agents.py. Different LLM agent policies can be customized. - Co-STORM introduces a collaborative discourse protocol, with its core function centered on turn policy management. We provide an example implementation of turn policy management through
DiscourseManagerinknowledge_storm/collaborative_storm/engine.py. It can be customized and further improved.
Datasets
To facilitate the study of automatic knowledge curation and complex information seeking, our project releases the following datasets:
FreshWiki
The FreshWiki Dataset is a collection of 100 high-quality Wikipedia articles focusing on the most-edited pages from February 2022 to September 2023. See Section 2.1 in STORM paper for more details.
You can download the dataset from huggingface directly. To ease the data contamination issue, we archive the source code for the data construction pipeline that can be repeated at future dates.
WildSeek
To study users’ interests in complex information seeking tasks in the wild, we utilized data collected from the web research preview to create the WildSeek dataset. We downsampled the data to ensure the diversity of the topics and the quality of the data. Each data point is a pair comprising a topic and the user’s goal for conducting deep search on the topic. For more details, please refer to Section 2.2 and Appendix A of Co-STORM paper.
The WildSeek dataset is available here.
Replicate STORM & Co-STORM paper result
For STORM paper experiments, please switch to the branch NAACL-2024-code-backup here.
For Co-STORM paper experiments, please switch to the branch EMNLP-2024-code-backup (placeholder for now, will be updated soon).
Roadmap & Contributions
Our team is actively working on:
- Human-in-the-Loop Functionalities: Supporting user participation in the knowledge curation process.
- Information Abstraction: Developing abstractions for curated information to support presentation formats beyond the Wikipedia-style report.
If you have any questions or suggestions, please feel free to open an issue or pull request. We welcome contributions to improve the system and the codebase!
Contact person: Yijia Shao and Yucheng Jiang
Acknowledgement
We would like to thank Wikipedia for its excellent open-source content. The FreshWiki dataset is sourced from Wikipedia, licensed under the Creative Commons Attribution-ShareAlike (CC BY-SA) license.
We are very grateful to Michelle Lam for designing the logo for this project and Dekun Ma for leading the UI development.
Thanks to Vercel for their support of open-source software
Citation
Please cite our paper if you use this code or part of it in your work:
@inproceedings{jiang-etal-2024-unknown,
    title = "Into the Unknown Unknowns: Engaged Human Learning through Participation in Language Model Agent Conversations",
    author = "Jiang, Yucheng  and
      Shao, Yijia  and
      Ma, Dekun  and
      Semnani, Sina  and
      Lam, Monica",
    editor = "Al-Onaizan, Yaser  and
      Bansal, Mohit  and
      Chen, Yun-Nung",
    booktitle = "Proceedings of the 2024 Conference on Empirical Methods in Natural Language Processing",
    month = nov,
    year = "2024",
    address = "Miami, Florida, USA",
    publisher = "Association for Computational Linguistics",
    url = "https://aclanthology.org/2024.emnlp-main.554/",
    doi = "10.18653/v1/2024.emnlp-main.554",
    pages = "9917--9955",
}

@inproceedings{shao-etal-2024-assisting,
    title = "Assisting in Writing {W}ikipedia-like Articles From Scratch with Large Language Models",
    author = "Shao, Yijia  and
      Jiang, Yucheng  and
      Kanell, Theodore  and
      Xu, Peter  and
      Khattab, Omar  and
      Lam, Monica",
    editor = "Duh, Kevin  and
      Gomez, Helena  and
      Bethard, Steven",
    booktitle = "Proceedings of the 2024 Conference of the North American Chapter of the Association for Computational Linguistics: Human Language Technologies (Volume 1: Long Papers)",
    month = jun,
    year = "2024",
    address = "Mexico City, Mexico",
    publisher = "Association for Computational Linguistics",
    url = "https://aclanthology.org/2024.naacl-long.347/",
    doi = "10.18653/v1/2024.naacl-long.347",
    pages = "6252--6278",
}
API for Whatsapp Web Multi Device Version, Support UI, Webhook & MCP
WhatsApp API Multi Device Version
![]()
If you're using this tools to generate income, consider supporting its development by becoming a Patreon member!
Your support helps ensure the library stays maintained and receives regular updates!

![]()
![]()
![]()
![]()
Support for ARM & AMD Architecture along with MCP Support
Download:
Support n8n package (n8n.io)
- n8n package
- Go to Settings -> Community Nodes -> Input
@aldinokemal2104/n8n-nodes-gowa-> Install
Breaking Changes
v6- For REST mode, you need to run
<binary> restinstead of<binary>- for example:
./whatsapp restinstead of./whatsapp
- for example:
- For MCP mode, you need to run
<binary> mcp- for example:
./whatsapp mcp
- for example:
- For REST mode, you need to run
Feature
-
Send WhatsApp message via http API, docs/openapi.yml for more details
-
MCP (Model Context Protocol) Server Support - Integrate with AI agents and tools using standardized protocol
-
Mention someone
@phoneNumber- example:
Hello @628974812XXXX, @628974812XXXX
-
Post Whatsapp Status
-
Compress image before send
-
Compress video before send
-
Change OS name become your app (it's the device name when connect via mobile)
--os=Chromeor--os=MyApplication
-
Basic Auth (able to add multi credentials)
--basic-auth=kemal:secret,toni:password,userName:secretPassword, or you can simplify-b=kemal:secret,toni:password,userName:secretPassword
-
Customizable port and debug mode
--port 8000--debug true
-
Auto reply message
--autoreply="Don't reply this message"
-
Webhook for received message
--webhook="http://yourwebhook.site/handler", or you can simplify-w="http://yourwebhook.site/handler"
-
Webhook Secret Our webhook will be sent to you with an HMAC header and a sha256 default key
secret.You may modify this by using the option below:
--webhook-secret="secret"
Configuration
You can configure the application using either command-line flags (shown above) or environment variables. Configuration can be set in three ways (in order of priority):
- Command-line flags (highest priority)
- Environment variables
.envfile (lowest priority)
Environment Variables
You can configure the application using environment variables. Configuration can be set in three ways (in order of priority):
- Command-line flags (highest priority)
- Environment variables
.envfile (lowest priority)
To use environment variables:
- Copy
.env.exampleto.envin your project root (cp src/.env.example src/.env) - Modify the values in
.envaccording to your needs - Or set the same variables as system environment variables
Available Environment Variables
| Variable | Description | Default | Example |
|---|---|---|---|
APP_PORT |
Application port | 3000 |
APP_PORT=8080 |
APP_DEBUG |
Enable debug logging | false |
APP_DEBUG=true |
APP_OS |
OS name (device name in WhatsApp) | Chrome |
APP_OS=MyApp |
APP_BASIC_AUTH |
Basic authentication credentials | - | APP_BASIC_AUTH=user1:pass1,user2:pass2 |
APP_CHAT_FLUSH_INTERVAL |
Chat flush interval in days | 7 |
APP_CHAT_FLUSH_INTERVAL=30 |
DB_URI |
Database connection URI | file:storages/whatsapp.db?_foreign_keys=on |
DB_URI=postgres://user:pass@host/db |
WHATSAPP_AUTO_REPLY |
Auto-reply message | - | WHATSAPP_AUTO_REPLY="Auto reply message" |
WHATSAPP_WEBHOOK |
Webhook URL(s) for events (comma-separated) | - | WHATSAPP_WEBHOOK=https://webhook.site/xxx |
WHATSAPP_WEBHOOK_SECRET |
Webhook secret for validation | secret |
WHATSAPP_WEBHOOK_SECRET=super-secret-key |
WHATSAPP_ACCOUNT_VALIDATION |
Enable account validation | true |
WHATSAPP_ACCOUNT_VALIDATION=false |
WHATSAPP_CHAT_STORAGE |
Enable chat storage | true |
WHATSAPP_CHAT_STORAGE=false |
Note: Command-line flags will override any values set in environment variables or .env file.
- For more command
./whatsapp --help
Requirements
System Requirements
- Go 1.24.0 or higher (for building from source)
- FFmpeg (for media processing)
Platform Support
- Linux (x86_64, ARM64)
- macOS (Intel, Apple Silicon)
- Windows (x86_64) - WSL recommended
Dependencies (without docker)
- Mac OS:
brew install ffmpegexport CGO_CFLAGS_ALLOW="-Xpreprocessor"
- Linux:
sudo apt updatesudo apt install ffmpeg
- Windows (not recomended, prefer using WSL):
- install ffmpeg, download here
- add to ffmpeg to environment variable
How to use
Basic
- Clone this repo:
git clone https://github.com/aldinokemal/go-whatsapp-web-multidevice - Open the folder that was cloned via cmd/terminal.
- run
cd src - run
go run . rest(for REST API mode) - Open
http://localhost:3000
Docker (you don't need to install in required)
- Clone this repo:
git clone https://github.com/aldinokemal/go-whatsapp-web-multidevice - Open the folder that was cloned via cmd/terminal.
- run
docker-compose up -d --build - open
http://localhost:3000
Build your own binary
- Clone this repo
git clone https://github.com/aldinokemal/go-whatsapp-web-multidevice - Open the folder that was cloned via cmd/terminal.
- run
cd src - run
- Linux & MacOS:
go build -o whatsapp - Windows (CMD / PowerShell):
go build -o whatsapp.exe
- Linux & MacOS:
- run
- Linux & MacOS:
./whatsapp rest(for REST API mode)- run
./whatsapp --helpfor more detail flags
- run
- Windows:
.\whatsapp.exe rest(for REST API mode)- run
.\whatsapp.exe --helpfor more detail flags
- run
- Linux & MacOS:
- open
http://localhost:3000in browser
MCP Server (Model Context Protocol)
This application can also run as an MCP server, allowing AI agents and tools to interact with WhatsApp through a standardized protocol.
- Clone this repo
git clone https://github.com/aldinokemal/go-whatsapp-web-multidevice - Open the folder that was cloned via cmd/terminal.
- run
cd src - run
go run . mcpor build the binary and run./whatsapp mcp - The MCP server will start on
http://localhost:8080by default
MCP Server Options
--host localhost- Set the host for MCP server (default: localhost)--port 8080- Set the port for MCP server (default: 8080)
Available MCP Tools
whatsapp_send_text- Send text messageswhatsapp_send_contact- Send contact cardswhatsapp_send_link- Send links with captionswhatsapp_send_location- Send location coordinates
MCP Endpoints
- SSE endpoint:
http://localhost:8080/sse - Message endpoint:
http://localhost:8080/message
MCP Configuration
Make sure you have the MCP server running: ./whatsapp mcp
For AI tools that support MCP with SSE (like Cursor), add this configuration:
{
  "mcpServers": {
    "whatsapp": {
      "url": "http://localhost:8080/sse"
    }
  }
}
Production Mode REST (docker)
docker run --detach --publish=3000:3000 --name=whatsapp --restart=always --volume=$(docker volume create --name=whatsapp):/app/storages aldinokemal2104/go-whatsapp-web-multidevice rest --autoreply="Dont't reply this message please"
Production Mode REST (docker compose)
create docker-compose.yml file with the following configuration:
services:
  whatsapp:
    image: aldinokemal2104/go-whatsapp-web-multidevice
    container_name: whatsapp
    restart: always
    ports:
      - "3000:3000"
    volumes:
      - whatsapp:/app/storages
    command:
      - rest
      - --basic-auth=admin:admin
      - --port=3000
      - --debug=true
      - --os=Chrome
      - --account-validation=false

volumes:
  whatsapp:
or with env file
services:
  whatsapp:
    image: aldinokemal2104/go-whatsapp-web-multidevice
    container_name: whatsapp
    restart: always
    ports:
      - "3000:3000"
    volumes:
      - whatsapp:/app/storages
    environment:
      - APP_BASIC_AUTH=admin:admin
      - APP_PORT=3000
      - APP_DEBUG=true
      - APP_OS=Chrome
      - APP_ACCOUNT_VALIDATION=false

volumes:
  whatsapp:
Production Mode (binary)
- download binary from release
You can fork or edit this source code !
Current API
MCP (Model Context Protocol) API
- MCP server provides standardized tools for AI agents to interact with WhatsApp
- Supports Server-Sent Events (SSE) transport
- Available tools:
whatsapp_send_text,whatsapp_send_contact,whatsapp_send_link,whatsapp_send_location - Compatible with MCP-enabled AI tools and agents
HTTP REST API
- API Specification Document.
- Check docs/openapi.yml for detailed API specifications.
- Use SwaggerEditor to visualize the API.
- Generate HTTP clients using openapi-generator.
| Feature | Menu | Method | URL |
|---|---|---|---|
| ✅ | Login with Scan QR | GET | /app/login |
| ✅ | Login With Pair Code | GET | /app/login-with-code |
| ✅ | Logout | GET | /app/logout |
| ✅ | Reconnect | GET | /app/reconnect |
| ✅ | Devices | GET | /app/devices |
| ✅ | User Info | GET | /user/info |
| ✅ | User Avatar | GET | /user/avatar |
| ✅ | User Change Avatar | POST | /user/avatar |
| ✅ | User Change PushName | POST | /user/pushname |
| ✅ | User My Groups | GET | /user/my/groups |
| ✅ | User My Newsletter | GET | /user/my/newsletters |
| ✅ | User My Privacy Setting | GET | /user/my/privacy |
| ✅ | User My Contacts | GET | /user/my/contacts |
| ✅ | Send Message | POST | /send/message |
| ✅ | Send Image | POST | /send/image |
| ✅ | Send Audio | POST | /send/audio |
| ✅ | Send File | POST | /send/file |
| ✅ | Send Video | POST | /send/video |
| ✅ | Send Contact | POST | /send/contact |
| ✅ | Send Link | POST | /send/link |
| ✅ | Send Location | POST | /send/location |
| ✅ | Send Poll / Vote | POST | /send/poll |
| ✅ | Send Presence | POST | /send/presence |
| ✅ | Revoke Message | POST | /message/:message_id/revoke |
| ✅ | React Message | POST | /message/:message_id/reaction |
| ✅ | Delete Message | POST | /message/:message_id/delete |
| ✅ | Edit Message | POST | /message/:message_id/update |
| ✅ | Read Message (DM) | POST | /message/:message_id/read |
| ✅ | Star Message | POST | /message/:message_id/star |
| ✅ | Unstar Message | POST | /message/:message_id/unstar |
| ✅ | Join Group With Link | POST | /group/join-with-link |
| ✅ | Leave Group | POST | /group/leave |
| ✅ | Create Group | POST | /group |
| ✅ | Add Participants in Group | POST | /group/participants |
| ✅ | Remove Participant in Group | POST | /group/participants/remove |
| ✅ | Promote Participant in Group | POST | /group/participants/promote |
| ✅ | Demote Participant in Group | POST | /group/participants/demote |
| ✅ | List Requested Participants in Group | GET | /group/participant-requests |
| ✅ | Approve Requested Participant in Group | POST | /group/participant-requests/approve |
| ✅ | Reject Requested Participant in Group | POST | /group/participant-requests/reject |
| ✅ | Unfollow Newsletter | POST | /newsletter/unfollow |
✅ = Available
❌ = Not Available Yet
User Interface
MCP UI
- Setup MCP (tested in cursor)

- Test MCP

- Successfully setup MCP

HTTP REST API UI
| Description | Image |
|---|---|
| Homepage |  |
| Login |  |
| Login With Code |  |
| Send Message |  |
| Send Image |  |
| Send File |  |
| Send Video |  |
| Send Contact |  |
| Send Location |  |
| Send Audio |  |
| Send Poll |  |
| Send Presence |  |
| Revoke Message |  |
| Delete Message |  |
| Reaction Message |  |
| Edit Message |  |
| User Info |  |
| User Avatar | |
| My Privacy |  |
| My Group |  |
| Create Group |  |
| Join Group with LInk |  |
| Auto Reply |  |
| Basic Auth Prompt |  |
| Manage Participant |  |
| My Newsletter |  |
Mac OS NOTE
- Please do this if you have an error (invalid flag in pkg-config --cflags: -Xpreprocessor)
export CGO_CFLAGS_ALLOW="-Xpreprocessor"
Important
- This project is unofficial and not affiliated with WhatsApp.
- Please use official WhatsApp API to avoid any issues.
- We only able to run MCP or REST API, this is limitation from whatsmeow library. independent MCP will be available in the future.
Docker container for managing Nginx proxy hosts with a simple, powerful interface

![]()
![]()
![]()
This project comes as a pre-built docker image that enables you to easily forward to your websites running at home or otherwise, including free SSL, without having to know too much about Nginx or Letsencrypt.
Project Goal
I created this project to fill a personal need to provide users with an easy way to accomplish reverse proxying hosts with SSL termination and it had to be so easy that a monkey could do it. This goal hasn't changed. While there might be advanced options they are optional and the project should be as simple as possible so that the barrier for entry here is low.

Features
- Beautiful and Secure Admin Interface based on Tabler
- Easily create forwarding domains, redirections, streams and 404 hosts without knowing anything about Nginx
- Free SSL using Let's Encrypt or provide your own custom SSL certificates
- Access Lists and basic HTTP Authentication for your hosts
- Advanced Nginx configuration available for super users
- User management, permissions and audit log
Hosting your home network
I won't go in to too much detail here but here are the basics for someone new to this self-hosted world.
- Your home router will have a Port Forwarding section somewhere. Log in and find it
- Add port forwarding for port 80 and 443 to the server hosting this project
- Configure your domain name details to point to your home, either with a static ip or a service like DuckDNS or Amazon Route53
- Use the Nginx Proxy Manager as your gateway to forward to your other web based services
Quick Setup
- Install Docker and Docker-Compose
- Create a docker-compose.yml file similar to this:
services:
  app:
    image: 'docker.io/jc21/nginx-proxy-manager:latest'
    restart: unless-stopped
    ports:
      - '80:80'
      - '81:81'
      - '443:443'
    volumes:
      - ./data:/data
      - ./letsencrypt:/etc/letsencrypt
This is the bare minimum configuration required. See the documentation for more.
- Bring up your stack by running
docker-compose up -d

# If using docker-compose-plugin
docker compose up -d
- Log in to the Admin UI
When your docker container is running, connect to it on port 81 for the admin interface. Sometimes this can take a little bit because of the entropy of keys.
Default Admin User:
Email:    [email protected]
Password: changeme
Immediately after logging in with this default user you will be asked to modify your details and change your password.
Contributing
All are welcome to create pull requests for this project, against the develop branch. Official releases are created from the master branch.
CI is used in this project. All PR's must pass before being considered. After passing, docker builds for PR's are available on dockerhub for manual verifications.
Documentation within the develop branch is available for preview at https://develop.nginxproxymanager.com
Contributors
Special thanks to all of our contributors.
Getting Support
小红书笔记 | 评论爬虫、抖音视频 | 评论爬虫、快手视频 | 评论爬虫、B 站视频 | 评论爬虫、微博帖子 | 评论爬虫、百度贴吧帖子 | 百度贴吧评论回复爬虫 | 知乎问答文章|评论爬虫
🔥 MediaCrawler - 自媒体平台爬虫 🕷️


免责声明:
大家请以学习为目的使用本仓库⚠️⚠️⚠️⚠️,爬虫违法违规的案件
本仓库的所有内容仅供学习和参考之用,禁止用于商业用途。任何人或组织不得将本仓库的内容用于非法用途或侵犯他人合法权益。本仓库所涉及的爬虫技术仅用于学习和研究,不得用于对其他平台进行大规模爬虫或其他非法行为。对于因使用本仓库内容而引起的任何法律责任,本仓库不承担任何责任。使用本仓库的内容即表示您同意本免责声明的所有条款和条件。
点击查看更为详细的免责声明。点击跳转
📖 项目简介
一个功能强大的多平台自媒体数据采集工具,支持小红书、抖音、快手、B站、微博、贴吧、知乎等主流平台的公开信息抓取。
🔧 技术原理
- 核心技术:基于 Playwright 浏览器自动化框架登录保存登录态
- 无需JS逆向:利用保留登录态的浏览器上下文环境,通过 JS 表达式获取签名参数
- 优势特点:无需逆向复杂的加密算法,大幅降低技术门槛
✨ 功能特性
| 平台 | 关键词搜索 | 指定帖子ID爬取 | 二级评论 | 指定创作者主页 | 登录态缓存 | IP代理池 | 生成评论词云图 |
|---|---|---|---|---|---|---|---|
| 小红书 | ✅ | ✅ | ✅ | ✅ | ✅ | ✅ | ✅ |
| 抖音 | ✅ | ✅ | ✅ | ✅ | ✅ | ✅ | ✅ |
| 快手 | ✅ | ✅ | ✅ | ✅ | ✅ | ✅ | ✅ |
| B 站 | ✅ | ✅ | ✅ | ✅ | ✅ | ✅ | ✅ |
| 微博 | ✅ | ✅ | ✅ | ✅ | ✅ | ✅ | ✅ |
| 贴吧 | ✅ | ✅ | ✅ | ✅ | ✅ | ✅ | ✅ |
| 知乎 | ✅ | ✅ | ✅ | ✅ | ✅ | ✅ | ✅ |
🔗 🚀 MediaCrawlerPro 重磅发布!更多的功能,更好的架构设计!
🚀 MediaCrawlerPro 重磅发布!
专注于学习成熟项目的架构设计,不仅仅是爬虫技术,Pro 版本的代码设计思路同样值得深入学习!
MediaCrawlerPro 相较于开源版本的核心优势:
🎯 核心功能升级
- ✅ 断点续爬功能(重点特性)
- ✅ 多账号 + IP代理池支持(重点特性)
- ✅ 去除 Playwright 依赖,使用更简单
- ✅ 完整 Linux 环境支持
🏗️ 架构设计优化
- ✅ 代码重构优化,更易读易维护(解耦 JS 签名逻辑)
- ✅ 企业级代码质量,适合构建大型爬虫项目
- ✅ 完美架构设计,高扩展性,源码学习价值更大
🎁 额外功能
- ✅ 自媒体视频下载器桌面端(适合学习全栈开发)
- ✅ 多平台首页信息流推荐(HomeFeed)
- 基于自媒体平台的AI Agent正在开发中 🚀🚀
点击查看:MediaCrawlerPro 项目主页 更多介绍
🚀 快速开始
💡 开源不易,如果这个项目对您有帮助,请给个 ⭐ Star 支持一下!
📋 前置依赖
🚀 uv 安装(推荐)
在进行下一步操作之前,请确保电脑上已经安装了 uv:
- 安装地址:uv 官方安装指南
- 验证安装:终端输入命令
uv --version,如果正常显示版本号,证明已经安装成功 - 推荐理由:uv 是目前最强的 Python 包管理工具,速度快、依赖解析准确
🟢 Node.js 安装
项目依赖 Node.js,请前往官网下载安装:
- 下载地址:https://nodejs.org/en/download/
- 版本要求:>= 16.0.0
📦 Python 包安装
# 进入项目目录
cd MediaCrawler

# 使用 uv sync 命令来保证 python 版本和相关依赖包的一致性
uv sync
🌐 浏览器驱动安装
# 安装浏览器驱动
uv run playwright install
💡 提示:MediaCrawler 目前已经支持使用 playwright 连接你本地的 Chrome 浏览器了,一些因为 Webdriver 导致的问题迎刃而解了。
目前开放了
xhs和dy这两个使用 CDP 的方式连接本地浏览器,如有需要,查看config/base_config.py中的配置项。
🚀 运行爬虫程序
# 项目默认是没有开启评论爬取模式,如需评论请在 config/base_config.py 中的 ENABLE_GET_COMMENTS 变量修改
# 一些其他支持项,也可以在 config/base_config.py 查看功能,写的有中文注释

# 从配置文件中读取关键词搜索相关的帖子并爬取帖子信息与评论
uv run main.py --platform xhs --lt qrcode --type search

# 从配置文件中读取指定的帖子ID列表获取指定帖子的信息与评论信息
uv run main.py --platform xhs --lt qrcode --type detail

# 打开对应APP扫二维码登录

# 其他平台爬虫使用示例,执行下面的命令查看
uv run main.py --help
🔗 使用 Python 原生 venv 管理环境(不推荐)
创建并激活 Python 虚拟环境
如果是爬取抖音和知乎,需要提前安装 nodejs 环境,版本大于等于:
16即可
# 进入项目根目录
cd MediaCrawler

# 创建虚拟环境
# 我的 python 版本是:3.9.6,requirements.txt 中的库是基于这个版本的
# 如果是其他 python 版本,可能 requirements.txt 中的库不兼容,需自行解决
python -m venv venv

# macOS & Linux 激活虚拟环境
source venv/bin/activate

# Windows 激活虚拟环境
venv\Scripts\activate
安装依赖库
pip install -r requirements.txt
安装 playwright 浏览器驱动
playwright install
运行爬虫程序(原生环境)
# 项目默认是没有开启评论爬取模式,如需评论请在 config/base_config.py 中的 ENABLE_GET_COMMENTS 变量修改
# 一些其他支持项,也可以在 config/base_config.py 查看功能,写的有中文注释

# 从配置文件中读取关键词搜索相关的帖子并爬取帖子信息与评论
python main.py --platform xhs --lt qrcode --type search

# 从配置文件中读取指定的帖子ID列表获取指定帖子的信息与评论信息
python main.py --platform xhs --lt qrcode --type detail

# 打开对应APP扫二维码登录

# 其他平台爬虫使用示例,执行下面的命令查看
python main.py --help
💾 数据保存
支持多种数据存储方式:
- MySQL 数据库:支持关系型数据库 MySQL 中保存(需要提前创建数据库)
- 执行
python db.py初始化数据库表结构(只在首次执行)
- 执行
- CSV 文件:支持保存到 CSV 中(
data/目录下) - JSON 文件:支持保存到 JSON 中(
data/目录下)
🚀 MediaCrawlerPro 重磅发布 🚀!更多的功能,更好的架构设计!
🤝 社区与支持
💬 交流群组
- 微信交流群:点击加入
📚 文档与教程
- 在线文档:MediaCrawler 完整文档
- 爬虫教程:CrawlerTutorial 免费教程
其他常见问题可以查看在线文档
在线文档包含使用方法、常见问题、加入项目交流群等。 MediaCrawler在线文档
作者提供的知识服务
如果想快速入门和学习该项目的使用、源码架构设计等、学习编程技术、亦或者想了解MediaCrawlerPro的源代码设计可以看下我的知识付费栏目。
⭐ Star 趋势图
如果这个项目对您有帮助,请给个 ⭐ Star 支持一下,让更多的人看到 MediaCrawler!
💰 赞助商展示

**Swiftproxy** - 90M+ 全球高质量纯净住宅IP,注册可领免费 500MB 测试流量,动态流量不过期! > 专属折扣码:**GHB5** 立享九折优惠!
Sider - 全网最火的 ChatGPT 插件,体验拉满!
🤝 成为赞助者
成为赞助者,可以将您的产品展示在这里,每天获得大量曝光!
联系方式:
- 微信:
yzglan - 邮箱:
[email protected]
📚 参考
- 小红书客户端:ReaJason 的 xhs 仓库
- 短信转发:SmsForwarder 参考仓库
- 内网穿透工具:ngrok 官方文档
免责声明
1. 项目目的与性质
本项目(以下简称“本项目”)是作为一个技术研究与学习工具而创建的,旨在探索和学习网络数据采集技术。本项目专注于自媒体平台的数据爬取技术研究,旨在提供给学习者和研究者作为技术交流之用。
2. 法律合规性声明
本项目开发者(以下简称“开发者”)郑重提醒用户在下载、安装和使用本项目时,严格遵守中华人民共和国相关法律法规,包括但不限于《中华人民共和国网络安全法》、《中华人民共和国反间谍法》等所有适用的国家法律和政策。用户应自行承担一切因使用本项目而可能引起的法律责任。
3. 使用目的限制
本项目严禁用于任何非法目的或非学习、非研究的商业行为。本项目不得用于任何形式的非法侵入他人计算机系统,不得用于任何侵犯他人知识产权或其他合法权益的行为。用户应保证其使用本项目的目的纯属个人学习和技术研究,不得用于任何形式的非法活动。
4. 免责声明
开发者已尽最大努力确保本项目的正当性及安全性,但不对用户使用本项目可能引起的任何形式的直接或间接损失承担责任。包括但不限于由于使用本项目而导致的任何数据丢失、设备损坏、法律诉讼等。
5. 知识产权声明
本项目的知识产权归开发者所有。本项目受到著作权法和国际著作权条约以及其他知识产权法律和条约的保护。用户在遵守本声明及相关法律法规的前提下,可以下载和使用本项目。
6. 最终解释权
关于本项目的最终解释权归开发者所有。开发者保留随时更改或更新本免责声明的权利,恕不另行通知。
🙏 致谢
JetBrains 开源许可证支持
感谢 JetBrains 为本项目提供免费的开源许可证支持!
12 weeks, 26 lessons, 52 quizzes, classic Machine Learning for all


![]()


Machine Learning for Beginners - A Curriculum
🌍 Travel around the world as we explore Machine Learning by means of world cultures 🌍
Cloud Advocates at Microsoft are pleased to offer a 12-week, 26-lesson curriculum all about Machine Learning. In this curriculum, you will learn about what is sometimes called classic machine learning, using primarily Scikit-learn as a library and avoiding deep learning, which is covered in our AI for Beginners' curriculum. Pair these lessons with our 'Data Science for Beginners' curriculum, as well!
Travel with us around the world as we apply these classic techniques to data from many areas of the world. Each lesson includes pre- and post-lesson quizzes, written instructions to complete the lesson, a solution, an assignment, and more. Our project-based pedagogy allows you to learn while building, a proven way for new skills to 'stick'.
✍️ Hearty thanks to our authors Jen Looper, Stephen Howell, Francesca Lazzeri, Tomomi Imura, Cassie Breviu, Dmitry Soshnikov, Chris Noring, Anirban Mukherjee, Ornella Altunyan, Ruth Yakubu and Amy Boyd
🎨 Thanks as well to our illustrators Tomomi Imura, Dasani Madipalli, and Jen Looper
🙏 Special thanks 🙏 to our Microsoft Student Ambassador authors, reviewers, and content contributors, notably Rishit Dagli, Muhammad Sakib Khan Inan, Rohan Raj, Alexandru Petrescu, Abhishek Jaiswal, Nawrin Tabassum, Ioan Samuila, and Snigdha Agarwal
🤩 Extra gratitude to Microsoft Student Ambassadors Eric Wanjau, Jasleen Sondhi, and Vidushi Gupta for our R lessons!
Getting Started
Follow these steps:
- Fork the Repository: Click on the "Fork" button at the top-right corner of this page.
- Clone the Repository:
git clone https://github.com/microsoft/ML-For-Beginners.git
find all additional resources for this course in our Microsoft Learn collection
Students, to use this curriculum, fork the entire repo to your own GitHub account and complete the exercises on your own or with a group:
- Start with a pre-lecture quiz.
- Read the lecture and complete the activities, pausing and reflecting at each knowledge check.
- Try to create the projects by comprehending the lessons rather than running the solution code; however that code is available in the
/solutionfolders in each project-oriented lesson. - Take the post-lecture quiz.
- Complete the challenge.
- Complete the assignment.
- After completing a lesson group, visit the Discussion Board and "learn out loud" by filling out the appropriate PAT rubric. A 'PAT' is a Progress Assessment Tool that is a rubric you fill out to further your learning. You can also react to other PATs so we can learn together.
For further study, we recommend following these Microsoft Learn modules and learning paths.
Teachers, we have included some suggestions on how to use this curriculum.
Video walkthroughs
Some of the lessons are available as short form video. You can find all these in-line in the lessons, or on the ML for Beginners playlist on the Microsoft Developer YouTube channel by clicking the image below.

Meet the Team
Gif by Mohit Jaisal
🎥 Click the image above for a video about the project and the folks who created it!
Pedagogy
We have chosen two pedagogical tenets while building this curriculum: ensuring that it is hands-on project-based and that it includes frequent quizzes. In addition, this curriculum has a common theme to give it cohesion.
By ensuring that the content aligns with projects, the process is made more engaging for students and retention of concepts will be augmented. In addition, a low-stakes quiz before a class sets the intention of the student towards learning a topic, while a second quiz after class ensures further retention. This curriculum was designed to be flexible and fun and can be taken in whole or in part. The projects start small and become increasingly complex by the end of the 12-week cycle. This curriculum also includes a postscript on real-world applications of ML, which can be used as extra credit or as a basis for discussion.
Find our Code of Conduct, Contributing, and Translation guidelines. We welcome your constructive feedback!
Each lesson includes
- optional sketchnote
- optional supplemental video
- video walkthrough (some lessons only)
- pre-lecture warmup quiz
- written lesson
- for project-based lessons, step-by-step guides on how to build the project
- knowledge checks
- a challenge
- supplemental reading
- assignment
- post-lecture quiz
A note about languages: These lessons are primarily written in Python, but many are also available in R. To complete an R lesson, go to the
/solutionfolder and look for R lessons. They include an .rmd extension that represents an R Markdown file which can be simply defined as an embedding ofcode chunks(of R or other languages) and aYAML header(that guides how to format outputs such as PDF) in aMarkdown document. As such, it serves as an exemplary authoring framework for data science since it allows you to combine your code, its output, and your thoughts by allowing you to write them down in Markdown. Moreover, R Markdown documents can be rendered to output formats such as PDF, HTML, or Word.
A note about quizzes: All quizzes are contained in Quiz App folder, for 52 total quizzes of three questions each. They are linked from within the lessons but the quiz app can be run locally; follow the instruction in the
quiz-appfolder to locally host or deploy to Azure.
| Lesson Number | Topic | Lesson Grouping | Learning Objectives | Linked Lesson | Author |
|---|---|---|---|---|---|
| 01 | Introduction to machine learning | Introduction | Learn the basic concepts behind machine learning | Lesson | Muhammad |
| 02 | The History of machine learning | Introduction | Learn the history underlying this field | Lesson | Jen and Amy |
| 03 | Fairness and machine learning | Introduction | What are the important philosophical issues around fairness that students should consider when building and applying ML models? | Lesson | Tomomi |
| 04 | Techniques for machine learning | Introduction | What techniques do ML researchers use to build ML models? | Lesson | Chris and Jen |
| 05 | Introduction to regression | Regression | Get started with Python and Scikit-learn for regression models |
|
|
| 06 | North American pumpkin prices 🎃 | Regression | Visualize and clean data in preparation for ML |
|
|
| 07 | North American pumpkin prices 🎃 | Regression | Build linear and polynomial regression models |
|
|
| 08 | North American pumpkin prices 🎃 | Regression | Build a logistic regression model |
|
|
| 09 | A Web App 🔌 | Web App | Build a web app to use your trained model | Python | Jen |
| 10 | Introduction to classification | Classification | Clean, prep, and visualize your data; introduction to classification |
|
|
| 11 | Delicious Asian and Indian cuisines 🍜 | Classification | Introduction to classifiers |
|
|
| 12 | Delicious Asian and Indian cuisines 🍜 | Classification | More classifiers |
|
|
| 13 | Delicious Asian and Indian cuisines 🍜 | Classification | Build a recommender web app using your model | Python | Jen |
| 14 | Introduction to clustering | Clustering | Clean, prep, and visualize your data; Introduction to clustering |
|
|
| 15 | Exploring Nigerian Musical Tastes 🎧 | Clustering | Explore the K-Means clustering method |
|
|
| 16 | Introduction to natural language processing ☕️ | Natural language processing | Learn the basics about NLP by building a simple bot | Python | Stephen |
| 17 | Common NLP Tasks ☕️ | Natural language processing | Deepen your NLP knowledge by understanding common tasks required when dealing with language structures | Python | Stephen |
| 18 | Translation and sentiment analysis ♥️ | Natural language processing | Translation and sentiment analysis with Jane Austen | Python | Stephen |
| 19 | Romantic hotels of Europe ♥️ | Natural language processing | Sentiment analysis with hotel reviews 1 | Python | Stephen |
| 20 | Romantic hotels of Europe ♥️ | Natural language processing | Sentiment analysis with hotel reviews 2 | Python | Stephen |
| 21 | Introduction to time series forecasting | Time series | Introduction to time series forecasting | Python | Francesca |
| 22 | ⚡️ World Power Usage ⚡️ - time series forecasting with ARIMA | Time series | Time series forecasting with ARIMA | Python | Francesca |
| 23 | ⚡️ World Power Usage ⚡️ - time series forecasting with SVR | Time series | Time series forecasting with Support Vector Regressor | Python | Anirban |
| 24 | Introduction to reinforcement learning | Reinforcement learning | Introduction to reinforcement learning with Q-Learning | Python | Dmitry |
| 25 | Help Peter avoid the wolf! 🐺 | Reinforcement learning | Reinforcement learning Gym | Python | Dmitry |
| Postscript | Real-World ML scenarios and applications | ML in the Wild | Interesting and revealing real-world applications of classical ML | Lesson | Team |
| Postscript | Model Debugging in ML using RAI dashboard | ML in the Wild | Model Debugging in Machine Learning using Responsible AI dashboard components | Lesson | Ruth Yakubu |
find all additional resources for this course in our Microsoft Learn collection
Offline access
You can run this documentation offline by using Docsify. Fork this repo, install Docsify on your local machine, and then in the root folder of this repo, type docsify serve. The website will be served on port 3000 on your localhost: localhost:3000.
PDFs
Find a pdf of the curriculum with links here.
Help Wanted
Would you like to contribute a translation? Please read our translation guidelines and add a templated issue to manage the workload here.
🎒 Other Courses
Our team produces other courses! Check out:
- Generative AI for Beginners
- Generative AI for Beginners .NET
- Generative AI with JavaScript
- AI for Beginners
- Data Science for Beginners
- ML for Beginners
- Cybersecurity for Beginners
- Web Dev for Beginners
- IoT for Beginners
- XR Development for Beginners
- Mastering GitHub Copilot for Paired Programming
- Mastering GitHub Copilot for C#/.NET Developers
- Choose Your Own Copilot Adventure
Master programming by recreating your favorite technologies from scratch.

Build your own <insert-technology-here>
This repository is a compilation of well-written, step-by-step guides for re-creating our favorite technologies from scratch.
What I cannot create, I do not understand — Richard Feynman.
It's a great way to learn.
- 3D Renderer
- Augmented Reality
- BitTorrent Client
- Blockchain / Cryptocurrency
- Bot
- Command-Line Tool
- Database
- Docker
- Emulator / Virtual Machine
- Front-end Framework / Library
- Game
- Git
- Network Stack
- Neural Network
- Operating System
- Physics Engine
- Programming Language
- Regex Engine
- Search Engine
- Shell
- Template Engine
- Text Editor
- Visual Recognition System
- Voxel Engine
- Web Browser
- Web Server
- Uncategorized
Tutorials
Build your own 3D Renderer
- C++: Introduction to Ray Tracing: a Simple Method for Creating 3D Images
- C++: How OpenGL works: software rendering in 500 lines of code
- C++: Raycasting engine of Wolfenstein 3D
- C++: Physically Based Rendering:From Theory To Implementation
- C++: Ray Tracing in One Weekend
- C++: Rasterization: a Practical Implementation
- C# / TypeScript / JavaScript: Learning how to write a 3D soft engine from scratch in C#, TypeScript or JavaScript
- Java / JavaScript: Build your own 3D renderer
- Java: How to create your own simple 3D render engine in pure Java
- JavaScript / Pseudocode: Computer Graphics from scratch
- Python: A 3D Modeller
Build your own Augmented Reality
- C#: How To: Augmented Reality App Tutorial for Beginners with Vuforia and Unity 3D [video]
- C#: How To Unity ARCore [video]
- C#: AR Portal Tutorial with Unity [video]
- C#: How to create a Dragon in Augmented Reality in Unity ARCore [video]
- C#: How to Augmented Reality AR Tutorial: ARKit Portal to the Upside Down [video]
- Python: Augmented Reality with Python and OpenCV
Build your own BitTorrent Client
- C#: Building a BitTorrent client from scratch in C#
- Go: Building a BitTorrent client from the ground up in Go
- Nim: Writing a Bencode Parser
- Node.js: Write your own bittorrent client
- Python: A BitTorrent client in Python 3.5
Build your own Blockchain / Cryptocurrency
- ATS: Functional Blockchain
- C#: Programming The Blockchain in C#
- Crystal: Write your own blockchain and PoW algorithm using Crystal
- Go: Building Blockchain in Go
- Go: Code your own blockchain in less than 200 lines of Go
- Java: Creating Your First Blockchain with Java
- JavaScript: A cryptocurrency implementation in less than 1500 lines of code
- JavaScript: Build your own Blockchain in JavaScript
- JavaScript: Learn & Build a JavaScript Blockchain
- JavaScript: Creating a blockchain with JavaScript
- JavaScript: How To Launch Your Own Production-Ready Cryptocurrency
- JavaScript: Writing a Blockchain in Node.js
- Kotlin: Let’s implement a cryptocurrency in Kotlin
- Python: Learn Blockchains by Building One
- Python: Build your own blockchain: a Python tutorial
- Python: A Practical Introduction to Blockchain with Python
- Python: Let’s Build the Tiniest Blockchain
- Ruby: Programming Blockchains Step-by-Step (Manuscripts Book Edition)
- Scala: How to build a simple actor-based blockchain
- TypeScript: Naivecoin: a tutorial for building a cryptocurrency
- TypeScript: NaivecoinStake: a tutorial for building a cryptocurrency with the Proof of Stake consensus
- Rust: Building A Blockchain in Rust & Substrate
Build your own Bot
- Haskell: Roll your own IRC bot
- Node.js: Creating a Simple Facebook Messenger AI Bot with API.ai in Node.js
- Node.js: How to make a responsive telegram bot
- Node.js: Create a Discord bot
- Node.js: gifbot - Building a GitHub App
- Node.js: Building A Simple AI Chatbot With Web Speech API And Node.js
- Python: How to Build Your First Slack Bot with Python
- Python: How to build a Slack Bot with Python using Slack Events API & Django under 20 minute
- Python: Build a Reddit Bot
- Python: How To Make A Reddit Bot [video]
- Python: How To Create a Telegram Bot Using Python
- Python: Create a Twitter Bot in Python Using Tweepy
- Python: Creating Reddit Bot with Python & PRAW [video]
- R: Build A Cryptocurrency Trading Bot with R
- Rust: A bot for Starcraft in Rust, C or any other language
Build your own Command-Line Tool
- Go: Visualize your local git contributions with Go
- Go: Build a command line app with Go: lolcat
- Go: Building a cli command with Go: cowsay
- Go: Go CLI tutorial: fortune clone
- Nim: Writing a stow alternative to manage dotfiles
- Node.js: Create a CLI tool in Javascript
- Rust: Command line apps in Rust
- Rust: Writing a Command Line Tool in Rust
- Zig: Build Your Own CLI App in Zig from Scratch
Build your own Database
- C: Let's Build a Simple Database
- C++: Build Your Own Redis from Scratch
- C#: Build Your Own Database
- Clojure: An Archaeology-Inspired Database
- Crystal: Why you should build your own NoSQL Database
- Go: Build Your Own Database from Scratch: Persistence, Indexing, Concurrency
- Go: Build Your Own Redis from Scratch
- JavaScript: Dagoba: an in-memory graph database
- Python: DBDB: Dog Bed Database
- Python: Write your own miniature Redis with Python
- Ruby: Build your own fast, persistent KV store in Ruby
- Rust: Build your own Redis client and server
Build your own Docker
- C: Linux containers in 500 lines of code
- Go: Build Your Own Container Using Less than 100 Lines of Go
- Go: Building a container from scratch in Go [video]
- Python: A workshop on Linux containers: Rebuild Docker from Scratch
- Python: A proof-of-concept imitation of Docker, written in 100% Python
- Shell: Docker implemented in around 100 lines of bash
Build your own Emulator / Virtual Machine
- C: Home-grown bytecode interpreters
- C: Virtual machine in C
- C: Write your Own Virtual Machine
- C: Writing a Game Boy emulator, Cinoop
- C++: How to write an emulator (CHIP-8 interpreter)
- C++: Emulation tutorial (CHIP-8 interpreter)
- C++: Emulation tutorial (GameBoy emulator)
- C++: Emulation tutorial (Master System emulator)
- C++: NES Emulator From Scratch [video]
- Common Lisp: CHIP-8 in Common Lisp
- JavaScript: GameBoy Emulation in JavaScript
- Python: Emulation Basics: Write your own Chip 8 Emulator/Interpreter
- Rust: 0dmg: Learning Rust by building a partial Game Boy emulator
Build your own Front-end Framework / Library
- JavaScript: WTF is JSX (Let's Build a JSX Renderer)
- JavaScript: A DIY guide to build your own React
- JavaScript: Building React From Scratch [video]
- JavaScript: Gooact: React in 160 lines of JavaScript
- JavaScript: Learn how React Reconciler package works by building your own lightweight React DOM
- JavaScript: Build Yourself a Redux
- JavaScript: Let’s Write Redux!
- JavaScript: Redux: Implementing Store from Scratch [video]
- JavaScript: Build Your own Simplified AngularJS in 200 Lines of JavaScript
- JavaScript: Make Your Own AngularJS
- JavaScript: How to write your own Virtual DOM
- JavaScript: Building a frontend framework, from scratch, with components (templating, state, VDOM)
- JavaScript: Build your own React
- JavaScript: Building a Custom React Renderer [video]
Build your own Game
- C: Handmade Hero
- C: How to Program an NES game in C
- C: Chess Engine In C [video]
- C: Let's Make: Dangerous Dave [video]
- C: Learn Video Game Programming in C [video]
- C: Coding A Sudoku Solver in C [video]
- C: Coding a Rogue/Nethack RPG in C [video]
- C: On Tetris and Reimplementation
- C++: Breakout
- C++: Beginning Game Programming v2.0
- C++: Tetris tutorial in C++ platform independent focused in game logic for beginners
- C++: Remaking Cavestory in C++ [video]
- C++: Reconstructing Cave Story [video]
- C++: Space Invaders from Scratch
- C#: Learn C# by Building a Simple RPG
- C#: Creating a Roguelike Game in C#
- C#: Build a C#/WPF RPG
- Go: Games With Go [video]
- Java: Code a 2D Game Engine using Java - Full Course for Beginners [video]
- Java: 3D Game Development with LWJGL 3
- JavaScript: 2D breakout game using Phaser
- JavaScript: How to Make Flappy Bird in HTML5 With Phaser
- JavaScript: Developing Games with React, Redux, and SVG
- JavaScript: Build your own 8-Ball Pool game from scratch [video]
- JavaScript: How to Make Your First Roguelike
- JavaScript: Think like a programmer: How to build Snake using only JavaScript, HTML & CSS
- Lua: BYTEPATH
- Python: Developing Games With PyGame
- Python: Making Games with Python & Pygame [pdf]
- Python: Roguelike Tutorial Revised
- Ruby: Developing Games With Ruby
- Ruby: Ruby Snake
- Rust: Adventures in Rust: A Basic 2D Game
- Rust: Roguelike Tutorial in Rust + tcod
Build your own Git
- Haskell: Reimplementing “git clone” in Haskell from the bottom up
- JavaScript: Gitlet
- JavaScript: Build GIT - Learn GIT
- Python: Just enough of a Git client to create a repo, commit, and push itself to GitHub
- Python: Write yourself a Git!
- Python: ugit: Learn Git Internals by Building Git Yourself
- Ruby: Rebuilding Git in Ruby
Build your own Network Stack
- C: Beej's Guide to Network Programming
- C: Let's code a TCP/IP stack
- C / Python: Build your own VPN/Virtual Switch
- Ruby: How to build a network stack in Ruby
Build your own Neural Network
- C#: Neural Network OCR
- F#: Building Neural Networks in F#
- Go: Build a multilayer perceptron with Golang
- Go: How to build a simple artificial neural network with Go
- Go: Building a Neural Net from Scratch in Go
- JavaScript / Java: Neural Networks - The Nature of Code [video]
- JavaScript: Neural networks from scratch for JavaScript linguists (Part1 — The Perceptron)
- Python: A Neural Network in 11 lines of Python
- Python: Implement a Neural Network from Scratch
- Python: Optical Character Recognition (OCR)
- Python: Traffic signs classification with a convolutional network
- Python: Generate Music using LSTM Neural Network in Keras
- Python: An Introduction to Convolutional Neural Networks
- Python: Neural Networks: Zero to Hero
Build your own Operating System
- Assembly: Writing a Tiny x86 Bootloader
- Assembly: Baking Pi – Operating Systems Development
- C: Building a software and hardware stack for a simple computer from scratch [video]
- C: Operating Systems: From 0 to 1
- C: The little book about OS development
- C: Roll your own toy UNIX-clone OS
- C: Kernel 101 – Let’s write a Kernel
- C: Kernel 201 – Let’s write a Kernel with keyboard and screen support
- C: Build a minimal multi-tasking kernel for ARM from scratch
- C: How to create an OS from scratch
- C: Malloc tutorial
- C: Hack the virtual memory
- C: Learning operating system development using Linux kernel and Raspberry Pi
- C: Operating systems development for Dummies
- C++: Write your own Operating System [video]
- C++: Writing a Bootloader
- Rust: Writing an OS in Rust
- Rust: Add RISC-V Rust Operating System Tutorial
- (any): Linux from scratch
Build your own Physics Engine
- C: Video Game Physics Tutorial
- C++: Game physics series by Allen Chou
- C++: How to Create a Custom Physics Engine
- C++: 3D Physics Engine Tutorial [video]
- JavaScript: How Physics Engines Work
- JavaScript: Broad Phase Collision Detection Using Spatial Partitioning
- JavaScript: Build a simple 2D physics engine for JavaScript games
Build your own Programming Language
- (any): mal - Make a Lisp
- Assembly: Jonesforth
- C: Baby's First Garbage Collector
- C: Build Your Own Lisp: Learn C and build your own programming language in 1000 lines of code
- C: Writing a Simple Garbage Collector in C
- C: C interpreter that interprets itself.
- C: A C & x86 version of the "Let's Build a Compiler" by Jack Crenshaw
- C: A journey explaining how to build a compiler from scratch
- C++: Writing Your Own Toy Compiler Using Flex
- C++: How to Create a Compiler [video]
- C++: Kaleidoscope: Implementing a Language with LLVM
- F#: Understanding Parser Combinators
- Elixir: Demystifying compilers by writing your own [video]
- Go: The Super Tiny Compiler
- Go: Lexical Scanning in Go [video]
- Haskell: Let's Build a Compiler
- Haskell: Write You a Haskell
- Haskell: Write Yourself a Scheme in 48 Hours
- Haskell: Write You A Scheme
- Java: Crafting interpreters: A handbook for making programming languages
- Java: Creating JVM Language
- JavaScript: The Super Tiny Compiler
- JavaScript: The Super Tiny Interpreter
- JavaScript: Little Lisp interpreter
- JavaScript: How to implement a programming language in JavaScript
- JavaScript: Let’s go write a Lisp
- OCaml: Writing a C Compiler
- OCaml: Writing a Lisp, the series
- Pascal: Let's Build a Compiler
- Python: A Python Interpreter Written in Python
- Python: lisp.py: Make your own Lisp interpreter
- Python: How to Write a Lisp Interpreter in Python
- Python: Let’s Build A Simple Interpreter
- Python: Make Your Own Simple Interpreted Programming Language [video]
- Python: From Source Code To Machine Code: Build Your Own Compiler From Scratch
- Racket: Beautiful Racket: How to make your own programming languages with Racket
- Ruby: A Compiler From Scratch
- Ruby: Markdown compiler from scratch in Ruby
- Rust: So You Want to Build a Language VM
- Rust: Learning Parser Combinators With Rust
- Swift: Building a LISP from scratch with Swift
- TypeScript: Build your own WebAssembly Compiler
Build your own Regex Engine
- C: A Regular Expression Matcher
- C: Regular Expression Matching Can Be Simple And Fast
- Go: How to build a regex engine from scratch
- JavaScript: Build a Regex Engine in Less than 40 Lines of Code
- JavaScript: How to implement regular expressions in functional javascript using derivatives
- JavaScript: Implementing a Regular Expression Engine
- Perl: How Regexes Work
- Python: Build Your Own Regular Expression Engines: Backtracking, NFA, DFA
- Scala: No Magic: Regular Expressions
Build your own Search Engine
- CSS: A search engine in CSS
- Python: Building a search engine using Redis and redis-py
- Python: Building a Vector Space Indexing Engine in Python
- Python: Building A Python-Based Search Engine [video]
- Python: Making text search learn from feedback
- Python: Finding Important Words in Text Using TF-IDF
Build your own Shell
- C: Tutorial - Write a Shell in C
- C: Let's build a shell!
- C: Writing a UNIX Shell
- C: Build Your Own Shell
- C: Write a shell in C
- Go: Writing a simple shell in Go
- Rust: Build Your Own Shell using Rust
Build your own Template Engine
- JavaScript: JavaScript template engine in just 20 lines
- JavaScript: Understanding JavaScript Micro-Templating
- Python: Approach: Building a toy template engine in Python
- Python: A Template Engine
- Ruby: How to write a template engine in less than 30 lines of code
Build your own Text Editor
- C: Build Your Own Text Editor
- C++: Designing a Simple Text Editor
- Python: Python Tutorial: Make Your Own Text Editor [video]
- Python: Create a Simple Python Text Editor!
- Ruby: Build a Collaborative Text Editor Using Rails
- Rust: Hecto: Build your own text editor in Rust
Build your own Visual Recognition System
- Python: Developing a License Plate Recognition System with Machine Learning in Python
- Python: Building a Facial Recognition Pipeline with Deep Learning in Tensorflow
Build your own Voxel Engine
Build your own Web Browser
Build your own Web Server
- C#: Writing a Web Server from Scratch
- Node.js: Build Your Own Web Server From Scratch In JavaScript
- Node.js: Let's code a web server from scratch with NodeJS Streams
- Node.js: lets-build-express
- PHP: Writing a webserver in pure PHP
- Python: A Simple Web Server
- Python: Let’s Build A Web Server.
- Python: Web application from scratch
- Python: Building a basic HTTP Server from scratch in Python
- Python: Implementing a RESTful Web API with Python & Flask
- Ruby: Building a simple websockets server from scratch in Ruby
Uncategorized
- (any): From NAND to Tetris: Building a Modern Computer From First Principles
- Alloy: The Same-Origin Policy
- C: How to Write a Video Player in Less Than 1000 Lines
- C: Learn how to write a hash table in C
- C: The very basics of a terminal emulator
- C: Write a System Call
- C: Sol - An MQTT broker from scratch
- C++: Build your own VR headset for $200
- C++: How X Window Managers work and how to write one
- C++: Writing a Linux Debugger
- C++: How a 64k intro is made
- C++: Make your own Game Engine
- C#: C# Networking: Create a TCP chater server, TCP games, UDP Pong and more
- C#: Loading and rendering 3D skeletal animations from scratch in C# and GLSL
- Clojure: Building a spell-checker
- Go: Build A Simple Terminal Emulator In 100 Lines of Golang
- Go: Let's Create a Simple Load Balancer
- Go: Video Encoding from Scratch
- Java: How to Build an Android Reddit App [video]
- JavaScript: Build Your Own Module Bundler - Minipack
- JavaScript: Learn JavaScript Promises by Building a Promise from Scratch
- JavaScript: Implementing promises from scratch (TDD way)
- JavaScript: Implement your own — call(), apply() and bind() method in JavaScript
- JavaScript: JavaScript Algorithms and Data Structures
- JavaScript: Build a ride hailing app with React Native
- JavaScript: Build Your Own AdBlocker in (Literally) 10 Minutes
- Kotlin: Build Your Own Cache
- Lua: Building a CDN from Scratch to Learn about CDN
- Nim: Writing a Redis Protocol Parser
- Nim: Writing a Build system
- Nim: Writing a MiniTest Framework
- Nim: Writing a DMIDecode Parser
- Nim: Writing a INI Parser
- Nim: Writing a Link Checker
- Nim: Writing a URL Shortening Service
- Node.js: Build a static site generator in 40 lines with Node.js
- Node.js: Building A Simple Single Sign On(SSO) Server And Solution From Scratch In Node.js.
- Node.js: How to create a real-world Node CLI app with Node
- Node.js: Build a DNS Server in Node.js
- PHP: Write your own MVC from scratch in PHP
- PHP: Make your own blog
- PHP: Modern PHP Without a Framework
- PHP: Code a Web Search Engine in PHP
- Python: Build a Deep Learning Library [video]
- Python: How to Build a Kick-Ass Mobile Document Scanner in Just 5 Minutes
- Python: Continuous Integration System
- Python: Recommender Systems in Python: Beginner Tutorial
- Python: Write SMS-spam detector with Scikit-learn
- Python: A Simple Content-Based Recommendation Engine in Python
- Python: Stock Market Predictions with LSTM in Python
- Python: Building a simple Generative Adversarial Network (GAN) using Tensorflow
- Python: Learn ML Algorithms by coding: Decision Trees
- Python: JSON Decoding Algorithm
- Python: Build your own Git plugin with python
- Ruby: A Pedometer in the Real World
- Ruby: Creating a Linux Desktop application with Ruby
- Rust: Building a DNS server in Rust
- Rust: Writing Scalable Chat Service from Scratch
- Rust: WebGL + Rust: Basic Water Tutorial
- TypeScript: Tiny Package Manager: Learns how npm or Yarn works
Contribute
- Submissions welcome, just send a PR, or create an issue
- Help us review pending submissions by leaving comments and "reactions"
Origins & License

This repository is the work of many contributors. It was started by Daniel Stefanovic, and is now maintained by CodeCrafters, Inc. To the extent possible under law, CodeCrafters, Inc. has waived all copyright and related or neighboring rights to this work.
A list of useful payloads and bypass for Web Application Security and Pentest/CTF
Payloads All The Things
A list of useful payloads and bypasses for Web Application Security. Feel free to improve with your payloads and techniques ! I ❤️ pull requests :)
You can also contribute with a 🍻 IRL, or using the sponsor button


An alternative display version is available at PayloadsAllTheThingsWeb.
📖 Documentation
Every section contains the following files, you can use the _template_vuln folder to create a new chapter:
- README.md - vulnerability description and how to exploit it, including several payloads
- Intruder - a set of files to give to Burp Intruder
- Images - pictures for the README.md
- Files - some files referenced in the README.md
You might also like the other projects from the AllTheThings family :
- InternalAllTheThings - Active Directory and Internal Pentest Cheatsheets
- HardwareAllTheThings - Hardware/IOT Pentesting Wiki
You want more ? Check the Books and Youtube channel selections.
🧑💻 Contributions
Be sure to read CONTRIBUTING.md
Thanks again for your contribution! ❤️
🍻 Sponsors
This project is proudly sponsored by these companies:


12 Weeks, 24 Lessons, AI for All!


![]()


![]()

Artificial Intelligence for Beginners - A Curriculum
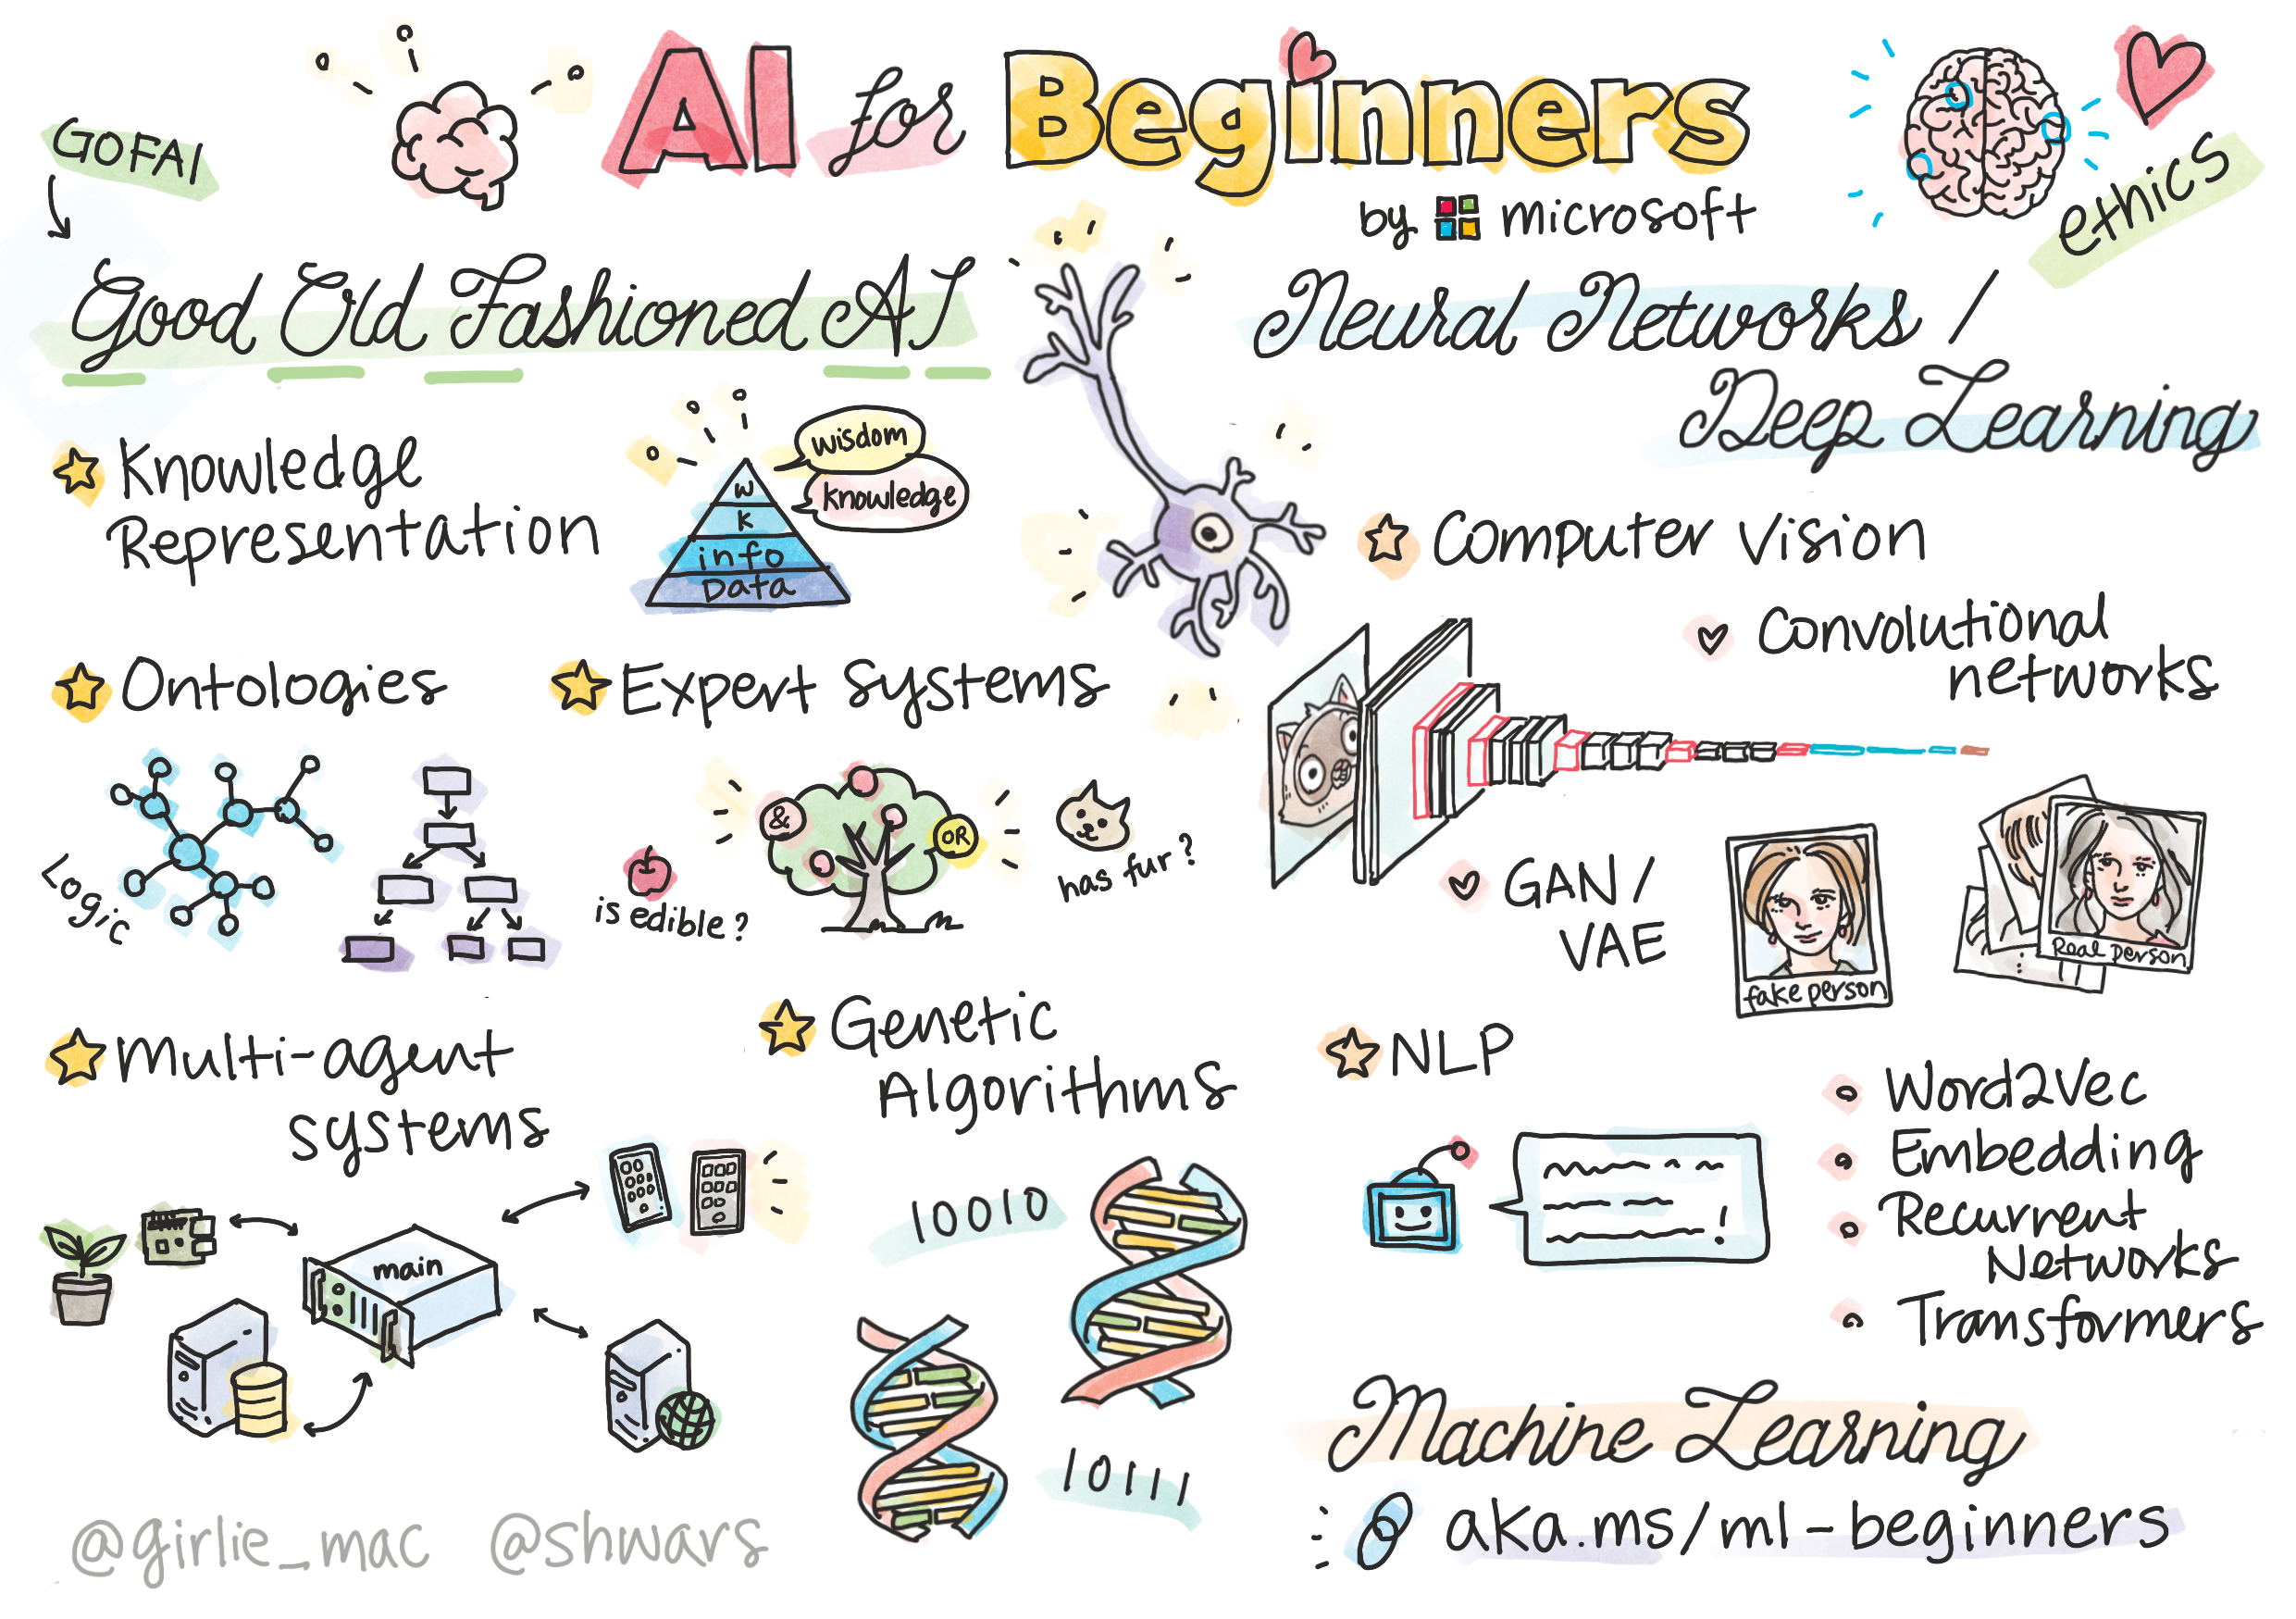 |
|---|
| AI For Beginners - Sketchnote by @girlie_mac |
Explore the world of Artificial Intelligence (AI) with our 12-week, 24-lesson curriculum! It includes practical lessons, quizzes, and labs. The curriculum is beginner-friendly and covers tools like TensorFlow and PyTorch, as well as ethics in AI
What you will learn
In this curriculum, you will learn:
- Different approaches to Artificial Intelligence, including the "good old" symbolic approach with Knowledge Representation and reasoning (GOFAI).
- Neural Networks and Deep Learning, which are at the core of modern AI. We will illustrate the concepts behind these important topics using code in two of the most popular frameworks - TensorFlow and PyTorch.
- Neural Architectures for working with images and text. We will cover recent models but may be a bit lacking in the state-of-the-art.
- Less popular AI approaches, such as Genetic Algorithms and Multi-Agent Systems.
What we will not cover in this curriculum:
Find all additional resources for this course in our Microsoft Learn collection
- Business cases of using AI in Business. Consider taking Introduction to AI for business users learning path on Microsoft Learn, or AI Business School, developed in cooperation with INSEAD.
- Classic Machine Learning, which is well described in our Machine Learning for Beginners Curriculum.
- Practical AI applications built using Cognitive Services. For this, we recommend that you start with modules Microsoft Learn for vision, natural language processing, Generative AI with Azure OpenAI Service and others.
- Specific ML Cloud Frameworks, such as Azure Machine Learning, Microsoft Fabric, or Azure Databricks. Consider using Build and operate machine learning solutions with Azure Machine Learning and Build and Operate Machine Learning Solutions with Azure Databricks learning paths.
- Conversational AI and Chat Bots. There is a separate Create conversational AI solutions learning path, and you can also refer to this blog post for more detail.
- Deep Mathematics behind deep learning. For this, we would recommend Deep Learning by Ian Goodfellow, Yoshua Bengio and Aaron Courville, which is also available online at https://www.deeplearningbook.org/.
For a gentle introduction to AI in the Cloud topics you may consider taking the Get started with artificial intelligence on Azure Learning Path.
Content
Each lesson contains
- Pre-reading material
- Executable Jupyter Notebooks, which are often specific to the framework (PyTorch or TensorFlow). The executable notebook also contains a lot of theoretical material, so to understand the topic you need to go through at least one version of the notebook (either PyTorch or TensorFlow).
- Labs available for some topics, which give you an opportunity to try applying the material you have learned to a specific problem.
- Some sections contain links to MS Learn modules that cover related topics.
Getting Started
- We have created a setup lesson to help you with setting up your development environment. - For Educators, we have created a curricula setup lesson for you too!
- How to Run the code in a VSCode or a Codepace
Follow these steps:
Fork the Repository: Click on the "Fork" button at the top-right corner of this page.
Clone the Repository: git clone https://github.com/microsoft/AI-For-Beginners.git
Don't forget to star (🌟) this repo to find it easier later.
Meet other Learners
Join our official AI Discord server to meet and network with other learners taking this course and get support.
If you have product feedback or questions whilst building visit our Azure AI Foundry Developer Forum
Quizzes
A note about quizzes: All quizzes are contained in the Quiz-app folder in etc\quiz-app, They are linked from within the lessons the quiz app can be run locally or deployed to Azure; follow the instruction in the
quiz-appfolder. They are gradually being localized.
Help Wanted
Do you have suggestions or found spelling or code errors? Raise an issue or create a pull request.
Special Thanks
- ✍️ Primary Author: Dmitry Soshnikov, PhD
- 🔥 Editor: Jen Looper, PhD
- 🎨 Sketchnote illustrator: Tomomi Imura
- ✅ Quiz Creator: Lateefah Bello, MLSA
- 🙏 Core Contributors: Evgenii Pishchik
Other Curricula
Our team produces other curricula! Check out:
- Generative AI for Beginners
- Generative AI for Beginners .NET
- Generative AI with JavaScript
- AI for Beginners
- Data Science for Beginners
- ML for Beginners
- Cybersecurity for Beginners
- Web Dev for Beginners
- IoT for Beginners
- XR Development for Beginners
- Mastering GitHub Copilot for Paired Programming
- Mastering GitHub Copilot for C#/.NET Developers
- Choose Your Own Copilot Adventure